Graph Algorithms in Neo4j: PageRank and Community Detection
Introduction
In our previous tutorial, we built a Knowledge Graph of the African Tech Ecosystem. But a graph is more than just a storage mechanism—it’s a powerful structure for analysis.
In this post, we’ll dive into Graph Algorithms. We’ll use them to uncover hidden patterns, identify influential players, and detect communities within our ecosystem.
Key Concept
Graph Data Science (GDS) is the application of graph algorithms to find patterns, clusters, and importance in connected data.
Setting Up Neo4j Graph Data Science (GDS)
First, ensure you have the Graph Data Science (GDS) Library installed in your Neo4j instance. If you’re using Neo4j Desktop, you can install it via the “Plugins” tab.
We’ll interact with GDS using the official Python client:
1
pip install graphdatascience
1
2
3
4
from graphdatascience import GraphDataScience

# Connect to Neo4j with GDS
gds = GraphDataScience("bolt://localhost:7687", auth=("neo4j", "password"))
1. Centrality Algorithms: Finding Influencers
Centrality algorithms identify the most important nodes in a graph.
PageRank
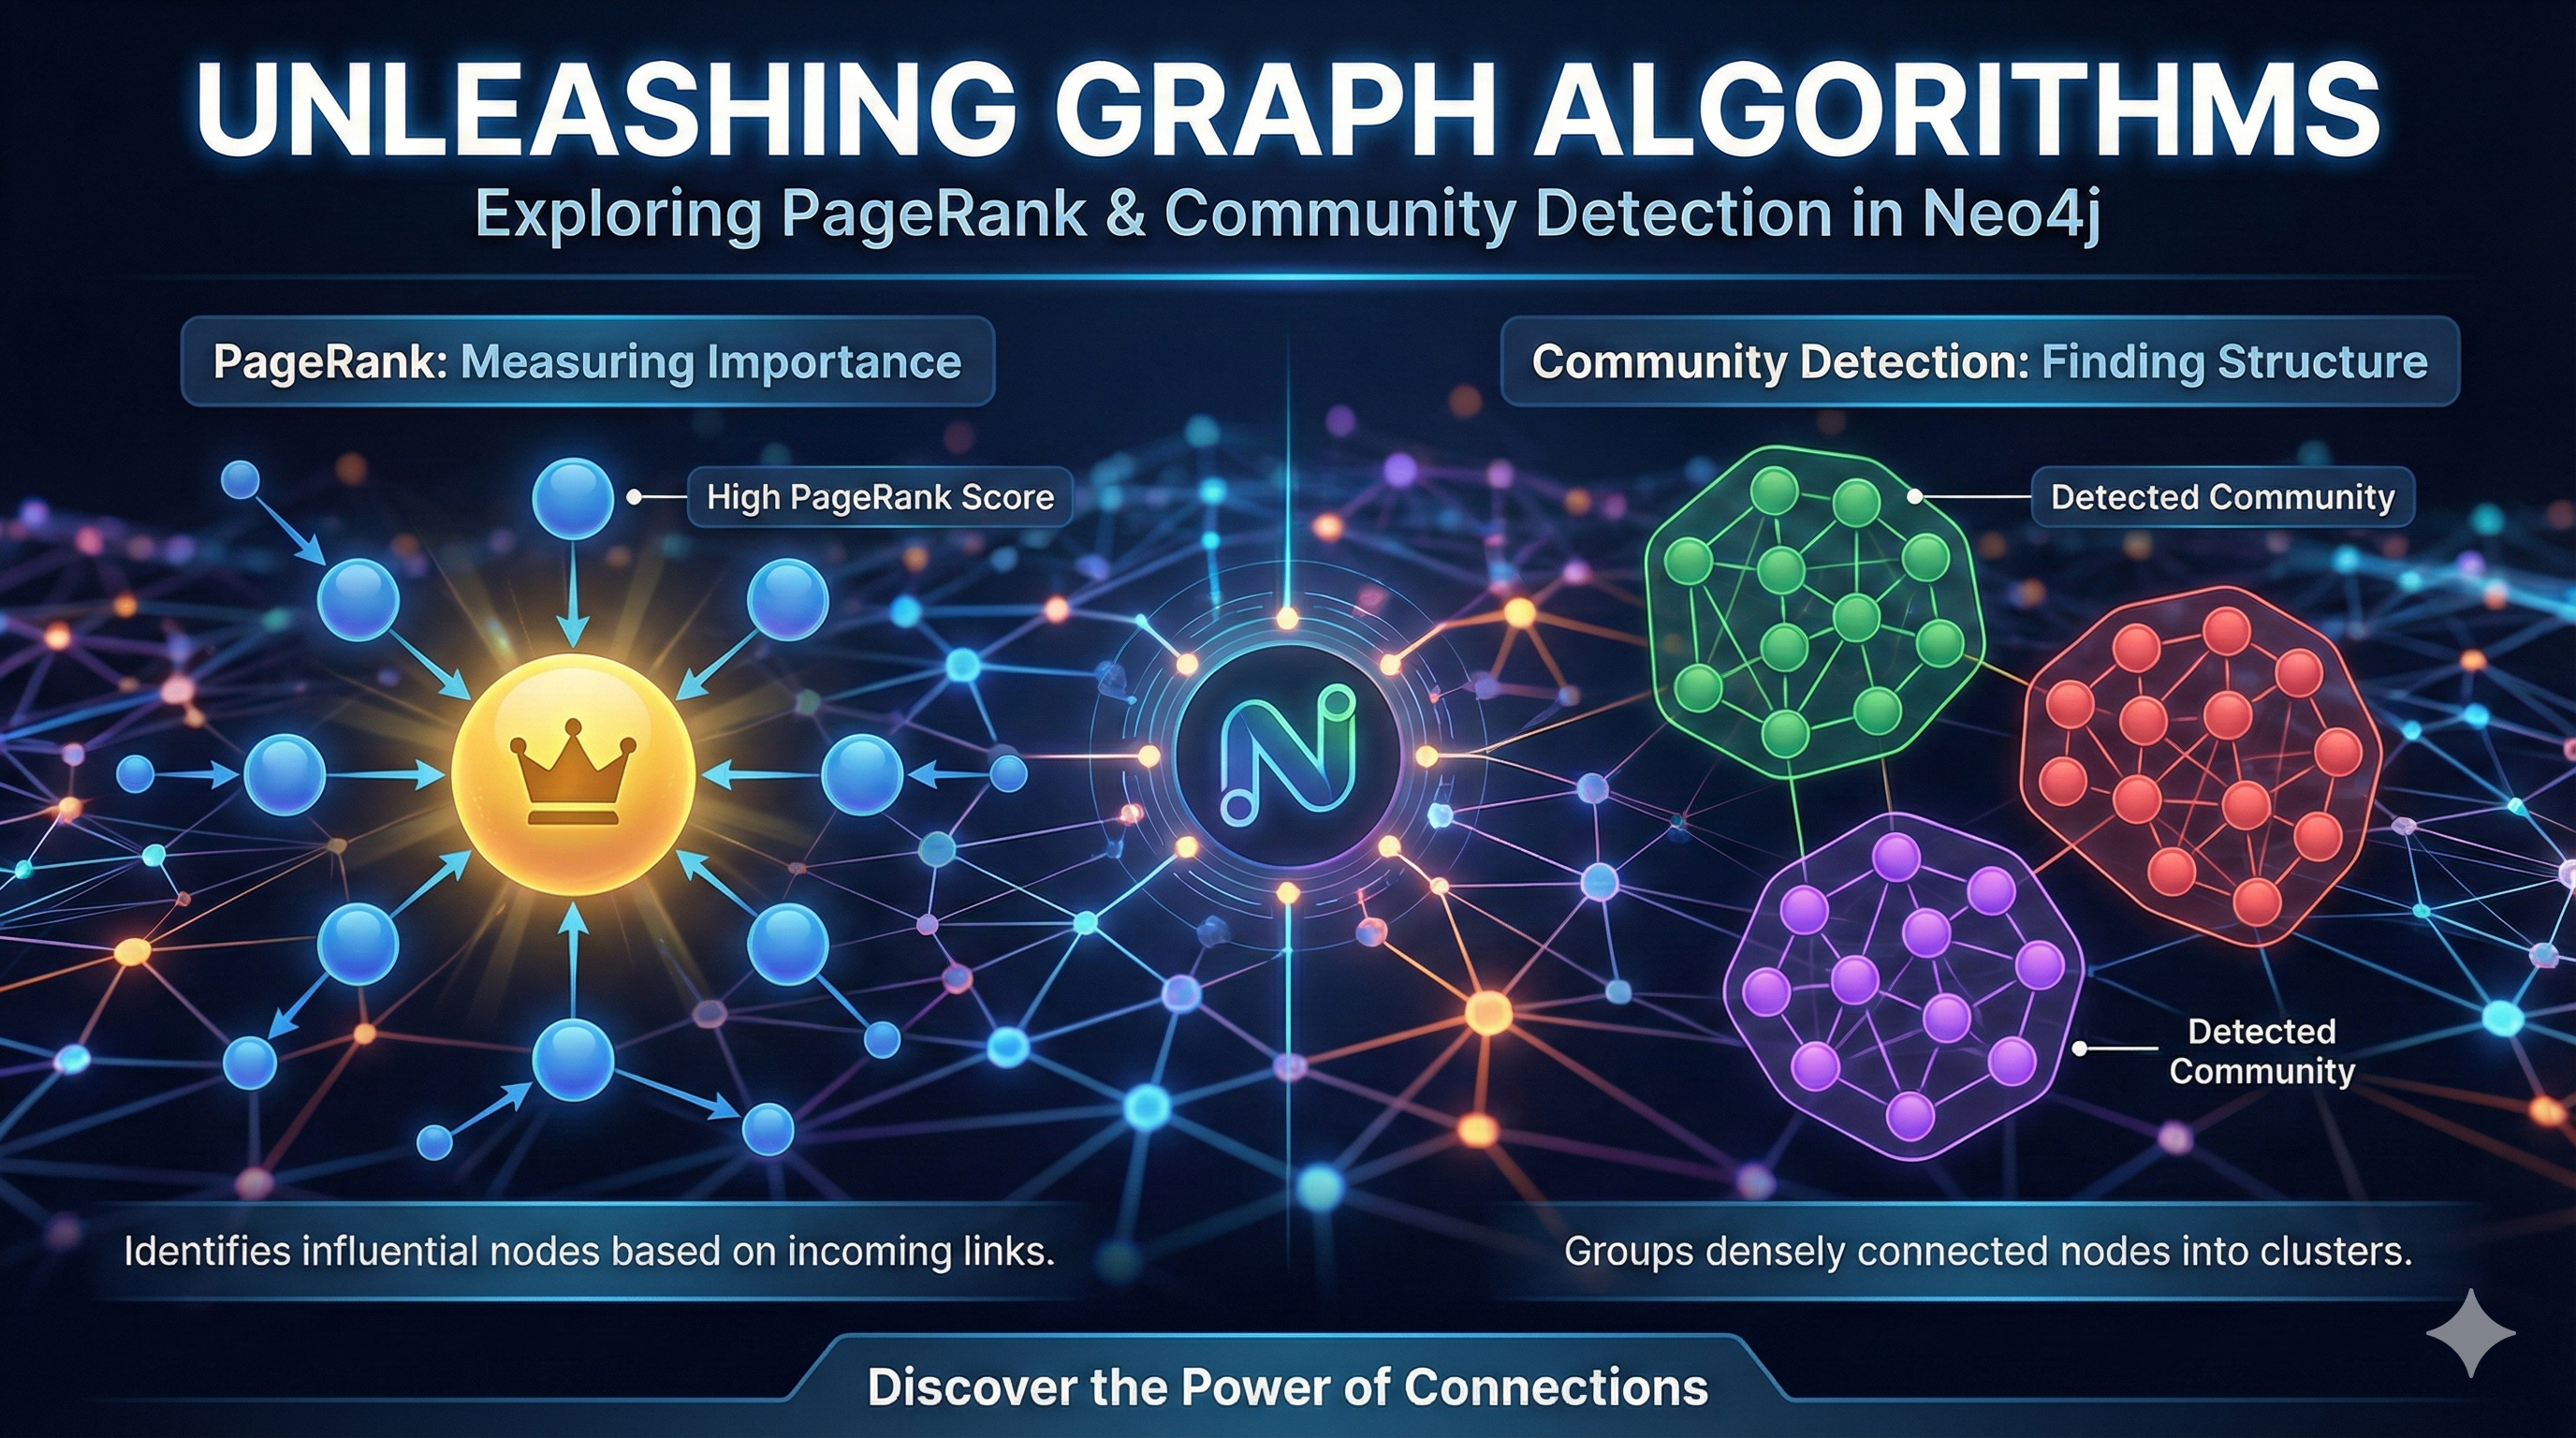
Originally used by Google to rank web pages, PageRank measures the importance of a node based on the importance of its incoming links. In our context, a startup is “important” if it’s connected to other important investors or founders.
Projecting the Graph: Before running algorithms, we project our graph into memory.
1
2
3
4
5
6
# Project a graph of Startups and Investors
gds.graph.project(
    "tech_ecosystem",
    ["Startup", "Investor"],
    "INVESTED_IN"
)
Running PageRank:
1
2
3
4
results = gds.pageRank.stream("tech_ecosystem")

# Top 5 most influential entities
print(results.sort_values("score", ascending=False).head(5))
Interpretation: High PageRank scores indicate startups that have attracted investment from highly connected investors, or investors who have backed many successful startups.
2. Community Detection: Finding Clusters
Community detection algorithms find groups of nodes that are more densely connected to each other than to the rest of the network.
Louvain Modularity
The Louvain method is excellent for detecting hierarchical communities. It can reveal “ecosystem hubs” – e.g., the “Fintech Cluster” or the “Nairobi Hub”.
1
2
3
4
5
6
# Run Louvain algorithm
results = gds.louvain.stream("tech_ecosystem")

# Group by communityId
communities = results.groupby("communityId")["nodeId"].apply(list)
print(communities.head())
Visualizing Communities:
graph TD
    subgraph Community 1: Fintech
    P[Paystack] --- F[Flutterwave]
    P --- S[Stripe]
    end

    subgraph Community 2: AgriTech
    T[Twiga Foods] --- C[Creadev]
    end

    style P fill:#ff6b6b
    style F fill:#ff6b6b
    style S fill:#ff6b6b
    style T fill:#6bcf7f
    style C fill:#6bcf7f
3. Pathfinding: Connecting the Dots
Shortest Path (Dijkstra / A*)
We already saw shortestPath in Cypher. GDS offers weighted shortest paths, useful if we had properties like “Investment Amount” as weights.
1
2
3
4
5
6
7
# Finding the weighted shortest path
path = gds.shortestPath.dijkstra.stream(
    "tech_ecosystem",
    sourceNode=source_id,
    targetNode=target_id,
    relationshipWeightProperty="amount"
)
Real-World Application: Investment Recommendation
We can combine these algorithms to build a recommendation engine:
- Identify Communities: Use Louvain to find the “Fintech” cluster.
- Rank Nodes: Use PageRank to find the most influential investors in that cluster.
- Recommend: Suggest these top investors to a new Fintech startup entering the ecosystem.
Conclusion
Graph algorithms allow us to move from descriptive analytics (“Who invested in whom?”) to predictive and prescriptive analytics (“Who should invest in whom?”).
By leveraging Neo4j GDS, we can unlock deep insights that are invisible in traditional tabular data.
Next Steps
In our next post, we’ll take this a step further and explore Graph Neural Networks (GNNs), where we’ll use these graph features to train deep learning models!
References
Related Posts:
Uncovering the hidden structure of data. 🚀