Africa's Outbreak Radar Reached 44 of 47 States: Reading What the Expansion Buys
Introduction
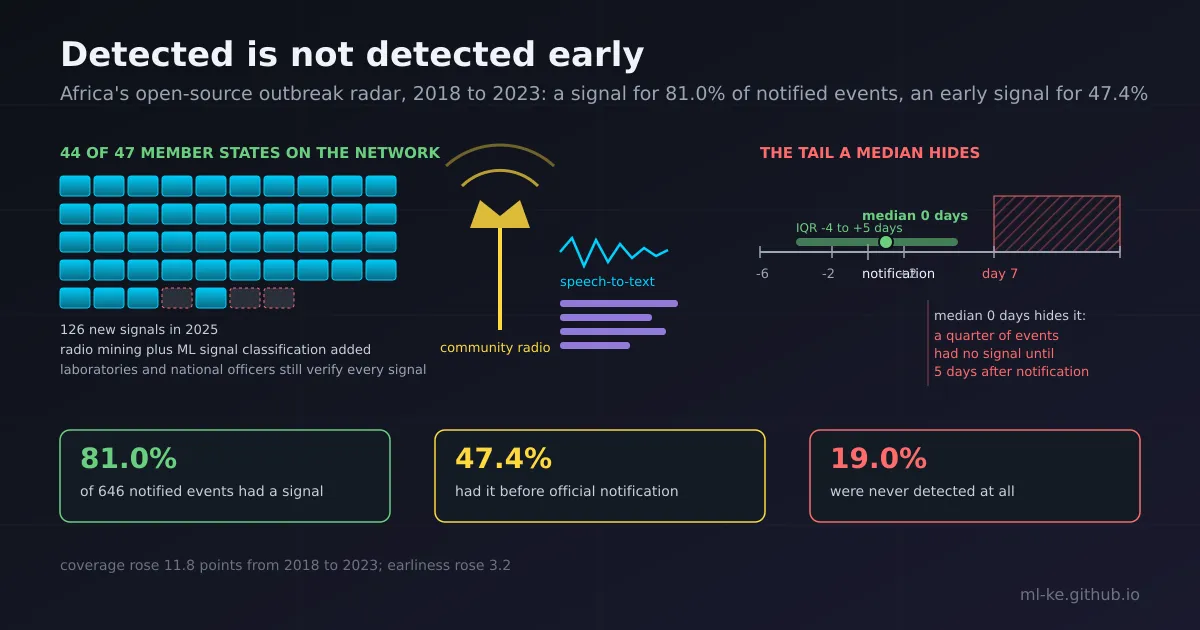
The report, in one line The WHO African Region’s October 2026 health emergency intelligence and surveillance report says its Epidemic Intelligence from Open Sources (EIOS) network now reaches 44 of 47 Member States, with speech-to-text radio mining and machine-learning signal classification added to the intelligence process: 126 new signals detected in 2025, a median of one day from detection to verification, and roughly 74% of outbreaks detected within seven days of occurring.
Good news about AI in public health usually arrives as a pilot with a press release attached. This one arrives with a peer-reviewed evaluation behind it, and that evaluation is the reason to read the October announcement carefully rather than skim it. The measurable question is not whether the software scans the open web. It is whether a signal reaches the right desk before the national authority would have filed the notification on its own, and on that question there are now six years of numbers.
Everything below comes from two WHO AFRO publications and one paper in BMC Public Health, with the figures re-derived from the paper’s own counts before being quoted.
What the report states, and whose performance it measures
The report mixes intelligence, laboratory and surveillance indicators into one summary, so it helps to separate them before reading any of them as a statement about AI.
| Indicator | What the October 2026 report states | Whose performance it measures |
|---|---|---|
| EIOS coverage | Expanded to 44 of 47 Member States | The intelligence network |
| New methods in the pipeline | Speech-to-text radio mining, machine-learning signal classification | The intelligence network |
| Signals detected in 2025 | 126, median one day from detection to verification | The intelligence network |
| Outbreaks detected within seven days | Approximately 74% of occurrences | The wider emergency system |
| IDSR assessment participation | 44 Member States, weekly data completeness 94% by week 52 | National surveillance reporting |
| Sequencing capacity | 46 of 47 Member States; 50,000+ GeneXpert cartridges deployed | Laboratory systems |
| Mpox external quality assessment | 89.4% detection success across 51 laboratories in 32 countries | Laboratory systems |
| Weekly Bulletin readership | Fourfold growth | Communications |
The laboratory and reporting lines are the load-bearing ones for the network’s future, and they are not AI scores. A machine-learning classifier reading a radio transcript in Yoruba or Lingala depends on a laboratory eventually confirming what the transcript described. Read together, the table describes a system getting denser at both ends: more sources streaming in, more states able to sequence and confirm what those sources describe.
One caveat is stated plainly in the report’s own coverage, because it is unusual for an announcement to carry it. The report does not attribute the 126 signals, the one-day median or the seven-day measure to machine learning specifically, and it publishes no false-alert rate and no comparison against the period before the software. The AI claim rests on a different document, published a year earlier, which is stronger evidence than a press release would have been.
The evaluation that came first
In 2025, Williams and colleagues at the WHO Regional Office for Africa evaluated EIOS retrospectively against every acute public health event the region’s 47 countries notified to WHO between 2018 and 2023. The design is the useful part: for each of 646 notified events, the researchers searched EIOS to see whether a signal had appeared, and when.
Two numbers came out of it, and they measure different things:
- Detection proportion, 81.0%: a signal for the event existed somewhere on the system at some point.
- Sensitivity, 47.4%: the signal was surfaced before the national authority notified WHO.
- Harmonic mean, 59.8%: the paper’s own single-figure compromise between the two.
The classification behind them is blunt about the shortfall: 306 events (47.4%) detected early, 217 (33.6%) detected late, and 123 (19.0%) never detected at all. Those events were notified to WHO by the countries themselves, so the system missed about one event in five entirely and a further third only after the paperwork had moved.
The paper also reports what predicts early detection, and two of its findings set the agenda that the October 2026 report answers. The odds of early detection were significantly higher for signals from medical sources (adjusted odds ratio 1.76, 95% CI 1.18 to 2.63) and from social media (3.45, 95% CI 1.51 to 8.27) compared with web news, and higher in Central Africa (2.73) and West Africa (2.35) than in Southern Africa. Then, in its conclusions, the study’s authors recommend two specific source additions: more social media, and local community radio. Radio and television accounted for 1.7% of the source types behind those 646 events, and English accounted for 73.4% of the language recorded.
Read the 2026 report against that recommendation and something rare happens: the recommendation was implemented. Speech-to-text radio mining is what a study concluding “incorporate local community radios” would ask for, and the report confirms it is running.
Coverage moved; earliness barely did
The evaluation’s yearly table contains the number that should be the benchmark for everything from here, and it is easier to see it recomputed from the raw counts than quoted as prose.
1
2
3
4
5
6
7
8
9
10
11
12
13
14
15
16
17
18
19
20
# Reproducing the paper's yearly performance table from its raw counts.
years = {
    2018: (111, 49, 35, 27),
    2019: (111, 41, 42, 28),
    2020: (109, 62, 25, 22),
    2021: (79, 39, 25, 15),
    2022: (124, 62, 45, 17),
    2023: (112, 53, 45, 14),
}
print(f"{'year':>4} {'events':>6} {'early':>5} {'late':>5} {'none':>5} {'detected':>9} {'sensitivity':>12} {'harmonic':>9}")
tot = [0, 0, 0, 0]
for year, (n, early, late, none) in years.items():
    for i, v in enumerate((n, early, late, none)):
        tot[i] += v
    dr, se = (early + late) / n, early / n
    print(f"{year:>4} {n:>6} {early:>5} {late:>5} {none:>5} {dr:>8.1%} {se:>11.1%} {2*dr*se/(dr+se):>8.1%}")
n, early, late, none = tot
dr, se = (early + late) / n, early / n
print(f"{'all':>4} {n:>6} {early:>5} {late:>5} {none:>5} {dr:>8.1%} {se:>11.1%} {2*dr*se/(dr+se):>8.1%}")
print(f"presence gain 2018-2023: {87.5 - 75.7:+.1f} points | earliness gain: {47.3 - 44.1:+.1f} points")
1
2
3
4
5
6
7
8
9
year events early  late  none  detected  sensitivity  harmonic
2018    111    49    35    27    75.7%       44.1%    55.8%
2019    111    41    42    28    74.8%       36.9%    49.4%
2020    109    62    25    22    79.8%       56.9%    66.4%
2021     79    39    25    15    81.0%       49.4%    61.3%
2022    124    62    45    17    86.3%       50.0%    63.3%
2023    112    53    45    14    87.5%       47.3%    61.4%
 all    646   306   217   123    81.0%       47.4%    59.8%
presence gain 2018-2023: +11.8 points | earliness gain: +3.2 points
The totals reproduce the published headline figures exactly, including the 59.8% harmonic mean. Two per-year cells land 0.1 point off the paper’s table (2018 harmonic mean 55.8 here against 55.7 published, 2021 61.3 against 61.4) because the paper appears to round the inputs before combining them. Everything else matches to the digit.
The trend in the last line is the story. Over six years, detection proportion climbed 11.8 points while sensitivity climbed 3.2. The network got much better at having a signal for every notified event, and barely better at having it early. Those are not the same achievement, and only one of them is the one that buys response time.
That gives the post-2026 measurement a clean test. Adding a radio-mining channel should move signal volume immediately and sensitivity only if the audio actually reaches a desk before the notification does. If the next annual report shows detection proportion edging past 90% while sensitivity sits near 47%, the expansion bought coverage rather than earliness, and the honest headline is the second number.
A median of zero days hides a tail of six
Timeliness is where summary statistics do the most damage, and the paper is unusually generous with the distribution. Across the 523 detected events, the median time from EIOS detection to notification was zero days, with an interquartile range of minus 4 to plus 5 days. Negative means the signal was published before the official notification; positive means after.
So the median says “same day” and the quartiles say something else: a quarter of detected events had no signal until more than five days after the country had already told WHO. For disasters the pattern is better and earlier (median minus 2, first quartile minus 6, sensitivity 73.1%), and for infectious outbreaks and zoonoses the median sits at zero and one day respectively. The 2023 quartile range had widened to minus 5 to plus 6.75.
The October 2026 report uses a different clock again: median one day from detection to verification, and about 74% of outbreaks detected within seven days of occurrence. Neither of those numbers is comparable to the 2018 to 2023 sensitivity series, since one measures how fast a signal is verified and the other measures how often a signal preceded a notification. When a system changes what it measures, the year-over-year comparison resets, and the reset should be stated rather than assumed away.
The source mix decides what arrives early
If radio mining is the intervention, the source table is the place to look, because the raw counts and the regression model tell different stories about which sources deliver early detection.
1
2
3
4
5
6
7
8
9
10
11
12
13
14
# Crude early-detection rate by source type, from the paper's published counts.
sources = {
    "Webnews":      (172, 85),
    "Medical":      (97, 96),
    "NGO":          (20, 16),
    "Radio/TV":     (7, 2),
    "Social media": (10, 18),
}
early_t = late_t = 0
for name, (early, late) in sources.items():
    early_t += early
    late_t += late
    print(f"{name:<13} early={early:>3} late={late:>3}  crude early rate={early/(early+late):>6.1%}")
print(f"{'all sources':<13} early={early_t:>3} late={late_t:>3}  crude early rate={early_t/(early_t+late_t):>6.1%}")
1
2
3
4
5
6
Webnews       early=172 late= 85  crude early rate= 66.9%
Medical       early= 97 late= 96  crude early rate= 50.3%
NGO           early= 20 late= 16  crude early rate= 55.6%
Radio/TV      early=  7 late=  2  crude early rate= 77.8%
Social media  early= 10 late= 18  crude early rate= 35.7%
all sources   early=306 late=217  crude early rate= 58.5%
Two traps sit in that output. The first is the radio row: seven early events out of nine looks like the best-performing source in the table, and nine events cannot carry any conclusion at all. The second is social media, whose crude early rate of 35.7% is the worst in the table while the same paper’s adjusted model puts its odds of early detection at 3.45 times web news. That gap is not a contradiction; it is what adjustment does: social media signals concentrate in hazards and subregions with lower baseline early detection, so the crude rate measures the mix of events as much as the source. Radio and television, meanwhile, had an adjusted odds ratio of 0.57 with a confidence interval from 0.08 to 2.51, which is a statistical way of saying “we could not tell.”
The modest shares explain why the authors pushed for more sources instead of a better model: medical sources and web news carried 86% of these events, and both the language mix (73.4% English) and the source mix (1.7% radio and television) show how much of the continent’s local reporting sat outside the feed. The October 2026 report confirms that radio mining and classification are running, but it publishes no comparable breakdown, so whether the added channel has shifted the language mix or moved sensitivity is, for now, an open question rather than a result.
Where the AI sits, and where it stops
EIOS is built on machine learning and natural language processing for the collection and analysis of publicly available information, and it is not a diagnostic tool. WHO’s own community reporting puts the network at more than 100 Member States and around 30 organisations, with about 4,500 professionals trained over five years across human, animal and environmental health. The same write-up records that nearly 50% of the region’s reported public health events between 2018 and 2023 were detected first through EIOS before official notification, which is the same order as the evaluation’s 47.4% early-detection rate across all notified events.
The verification step stays human and national by design. A radio transcript or a social media post is a signal that a person in a ministry of health then has to confirm with a laboratory, a clinic or a district officer. That is also why the expansion’s second half is political rather than technical: the region’s ministries adopted a New York Call to Action on Cross-Border Preparedness Intelligence at a dialogue on the margins of the UN General Assembly on 25 September 2026, alongside the Preparedness Data Exchange (PDX) that WHO AFRO launched in March 2026. PDX integrates surveillance, climate and health system indicators, and the stated design keeps countries in control of their own data while sharing the intelligence derived from it. Ten African health ministries signed a cross-border collaboration memorandum in August 2026 at the 76th session of the WHO Regional Committee for Africa, building on the Bangui Communiqué’s commitments on harmonised alerts.
Arranging data sovereignty that way is the difference between a pilot that ends and a system that persists, because the constraint on a regional signal network is rarely the classifier. It is who is allowed to see the signal, and who has to act on it at 2am.
How to apply this
If you run, fund or evaluate a signal-detection system, the EIOS record is a usable template for what to measure.
- Report sensitivity next to detection proportion, always. “We found a signal for 81% of events” and “we found it early for 47.4%” are both true of the same system, and only the second shortens a response.
- Publish the false-alert rate. The October 2026 report does not, and no analyst can size a verification desk without it. An intelligence team’s capacity is a fixed number of verifications per day; a system that raises recall without reporting its noise is asking for unpaid work.
- Keep the denominator at events, not signals. Sources multiply: one outbreak generates a ministry statement, a radio segment and a dozen posts. Counting signals rewards adding channels and hides whether coverage improved, which is why the evaluation counted notified events.
- Treat a new source as a hypothesis. Radio mining was added because a study recommended it, not because a study tested it. The pre-registered version of that test is a sensitivity comparison before and after, by language and subregion, on the same event denominator.
- Measure the language mix with the source mix. English carried 73.4% of the sources behind those 646 events in a region where English is a minority first language. If a new channel does not move that number, it is amplifying the reporting that already existed.
- Budget the human loop, not just the pipeline. Classification is cheap; verification is the cost centre, and it is the step every published sensitivity figure silently assumes.
Key takeaways
| Point | Detail |
|---|---|
| What changed | WHO AFRO’s October 2026 report: EIOS reached 44 of 47 Member States, with speech-to-text radio mining and machine-learning signal classification added |
| Why it matters | Nearly 50% of the region’s reported events in 2018 to 2023 were surfaced first through the open-source system, which is response time no national system was producing alone |
| The evidence base | A 2025 BMC Public Health evaluation of 646 notified events: 81.0% detection proportion, 47.4% sensitivity, 59.8% harmonic mean, 19.0% never detected |
| The number to watch | Detection proportion rose 11.8 points from 2018 to 2023 while sensitivity rose 3.2, so coverage improved far faster than earliness |
| What the announcement does not say | No false-alert rate, no counterfactual, and no attribution of the 126 signals or the one-day median to the machine-learning step |
| Source coverage was the diagnosed weakness | Radio and television were 1.7% of sources and English 73.4% of languages; the evaluation recommended community radio, and the 2026 report says radio mining shipped |
| The honest test | If next year’s report shows detection near 90% and sensitivity still near 47%, the expansion bought coverage rather than time |
References
- WHO Regional Office for Africa — Health Emergency Intelligence and Surveillance, quarter three report 2026 — EIOS at 44 of 47 Member States, radio mining, ML classification, 126 signals, one-day median, 74% within seven days, laboratory and IDSR indicators
- WHO Regional Office for Africa — Public health intelligence 2026 — the 2025 expansion of EIOS and the integration of speech-to-text radio mining and machine-learning-supported signal classification
- Williams GS, Koua EL, Abdelmalik P, and colleagues — Evaluation of the epidemic intelligence from open sources (EIOS) system for the early detection of outbreaks and health emergencies in the African region — BMC Public Health 25:857, 2025; 646 events, detection proportion, sensitivity, timeliness quartiles, source and language tables, adjusted odds ratios
- Medialdea Carrera R, Sabri SE, Rabiyan Y, and colleagues — Building the future of public health intelligence: updates from the fifth EIOS Global Technical Meeting — more than 100 Member States, about 4,500 professionals trained, nearly 50% of 2018 to 2023 regional events detected first through EIOS
- WHO Regional Office for Africa — Advancing Africa’s cross-border collaboration through AI-assisted health emergency preparedness — the 25 September 2026 dialogue, the New York Call to Action, PDX, Voyage Sante+, the Bangui Communiqué and the 10-country memorandum of understanding
- WHO — The Epidemic Intelligence from Open Sources initiative — EIOS Strategy 2024 to 2026, machine learning and natural language processing for open-source collection and analysis
- Streamline — WHO expands Africa’s AI outbreak-watch network, 12 October 2026 — independent read of the same report, including the explicit statement that its figures do not isolate the effect of machine learning
- The Peninsula — African health leaders urge nations to leverage AI for epidemic early warning, 27 September 2026 — PDX launched March 2026, data control design, Dr Mohamed Janabi on turning the call to action into national policy
Related posts
- Prequalified: WHO Opens Its Procurement List to AI TB Screening Software — the other half of the same problem: what a ministry can buy, and what a listing proves
- The Bottleneck Is Adoption, Not Innovation — why the verification step, not the model, decides whether a health AI changes an outcome
- Certified in Europe, Judged at the Health Post — what transfers from a regulator’s evaluation to a district
- The Denominator Is the Metric — why “found it” and “found it in time” need separate numerators
- Your Corpus Is Duplicating Itself — the dedup step that stands between a signal count and an event count