Anomaly Detection for Reconciliation at Scale: Catching What Thresholds Miss
Reconciliation is a rear-view mirror
In June 2025, a contractor at NCBA Bank Rwanda altered the MTN mobile-money integration so every withdrawal returned “success” — even when the account did not exist or had insufficient funds. Over eight days, 70 ghost accounts initiated 260 transactions that drained roughly USD 446,000 (Ksh 57.5 million) before the bank stopped it on June 14. The fraud was finally caught not by a real-time alert but by end-of-week settlement reconciliation, when NCBA matched its records against MTN Rwanda’s figures and found a major difference.
That is the uncomfortable truth about reconciliation: it is the most reliable detector in banking, and it is a rear-view mirror. The NCBA catch happened after the money had left. Reconciliation answers “did the books match?” — the analytics question is “could we have seen it while it was still happening?”
The pattern to internalize: reconciliation detects what happened. Anomaly detection detects what does not fit — and it can run continuously, on every line, before the weekly match ever runs.
Fixed thresholds are the Flutterwave problem
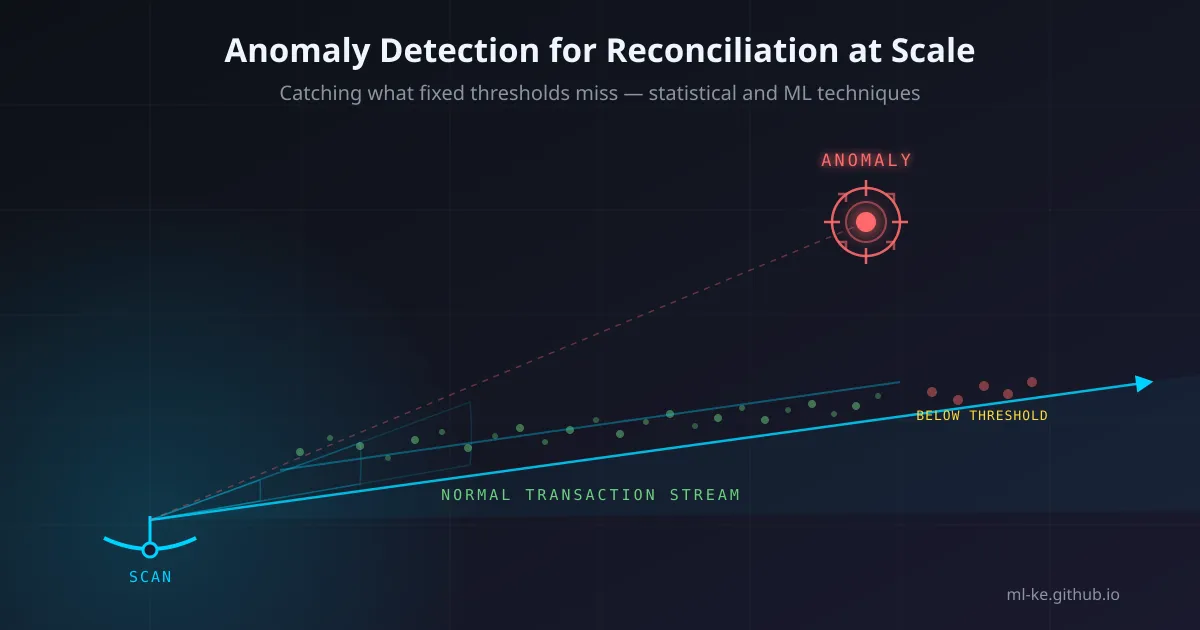
The April 2024 Flutterwave incident shows why static rules are not enough. Attackers moved ₦11 billion (~$7 million) to five institutions over four days — reportedly more, by insider account — and it went undetected because the deposits were kept below the fraud-check trigger limits. A rule that says “flag any deposit above X” is a published target: the attacker reads X, splits the flow into pieces below X, and every single line looks ordinary.
There is a second, quieter failure of threshold overload: false positives. Danske Bank, before its machine-learning overhaul with Teradata, was managing up to 1,200 false positives per day, with 99.5% of investigated cases turning out not to be fraud. A detection stack that screams constantly trains analysts to ignore it — and the real signal drowns in the noise.
The statistical toolkit (no ML required)
Before reaching for models, three classical techniques belong in every reconciliation analytics stack:
- Modified z-score — a robust outlier score based on the median and median absolute deviation (MAD). Unlike the plain z-score it is not dragged around by the outliers it is trying to find.
- IQR / Tukey fences — flag anything outside
[Q1 − 1.5×IQR, Q3 + 1.5×IQR]; cheap, explainable, good for control-total distributions. - CUSUM — a cumulative-sum control chart that catches drift: a settlement total that creeps away from the partner’s statement by small amounts every day, where point-in-time checks see nothing.
1
2
3
4
5
6
import statistics
amounts = [1012, 998, 1043, 991, 1008, 22000, 1004]  # one spike on day 6
med = statistics.median(amounts)
mad = statistics.median(abs(a - med) for a in amounts)
scores = [0.6745 * (a - med) / mad for a in amounts]
print([round(s, 1) for s in scores])  # [0.3, -0.7, 2.4, -1.1, 0.0, 1415.9, -0.3]
Unsupervised ML: features on the entity, not the line
Statistical tests look at individual lines. Distributed fraud looks normal per line — so you have to change the unit of analysis. Build per-entity, per-day aggregates — count, sum, max, average — and let an unsupervised model find the entity-days that do not fit the population. Isolation Forest is the workhorse: it isolates anomalies by how few splits they need to be separated from the pack, needs no labels, and handles high-dimensional feature vectors naturally.
Here is the full comparison, run against a simulated 90-day settlement stream (200 lines/day, 200 merchants, weekly seasonality) with two planted attacks: a single 22× spike on day 40, and a Flutterwave-style distributed attack (12 days of sub-threshold additions by one merchant):
1
2
3
4
5
6
7
8
9
10
11
12
13
14
15
16
17
18
19
20
21
22
23
24
25
26
27
28
29
30
31
32
33
34
35
import random, statistics
from collections import defaultdict
import numpy as np
from sklearn.ensemble import IsolationForest

random.seed(42)
BASE = 1000.0
lines = []  # (day, entity, amount)
for day in range(90):
    for _ in range(200):
        amt = BASE * random.uniform(0.3, 1.7) * (0.7 if day % 7 in (5, 6) else 1.0)
        lines.append((day, f"merchant-{random.randint(1, 200)}", amt))
lines.append((40, "merchant-7", BASE * 22.0))                     # spike
for day in range(60, 72):                                          # distributed
    for _ in range(9):
        lines.append((day, "merchant-133", BASE * 0.5 * random.uniform(0.3, 1.7)))

med = statistics.median(a for _, _, a in lines)
mad = statistics.median(abs(a - med) for _, _, a in lines)
flagged_z = [(d, e) for d, e, a in lines if 0.6745 * (a - med) / mad > 6.0]
print(f"z-score flags: {len(flagged_z)} line(s); distributed lines caught: "
      f"{sum(1 for _, e in flagged_z if e == 'merchant-133')}")

agg = defaultdict(lambda: [0, 0.0, 0.0])
for day, ent, amt in lines:
    agg[(day, ent)][0] += 1
    agg[(day, ent)][1] += amt
    agg[(day, ent)][2] = max(agg[(day, ent)][2], amt)
keys = sorted(agg)
X = np.array([[agg[k][0], agg[k][1], agg[k][2], agg[k][1] / agg[k][0]] for k in keys])
pred = IsolationForest(contamination=0.01, random_state=7).fit_predict(X)
flagged_if = [keys[i] for i, p in enumerate(pred) if p == -1]
print(f"IF flags: {len(flagged_if)} entity-days of {len(keys)} "
      f"(distributed: {sum(1 for d, e in flagged_if if e == 'merchant-133')}/12, "
      f"spike: {sum(1 for d, e in flagged_if if d == 40 and e == 'merchant-7')}/1)")
Verified output (Python 3.11, scikit-learn 1.x, seed 42):
1
2
z-score flags: 1 line(s); distributed lines caught: 0
IF flags: 115 entity-days of 11462 (distributed: 12/12, spike: 1/1)
| Detector | Unit of analysis | Spike caught? | Distributed caught? | Alerts |
|---|---|---|---|---|
| Modified z-score (> 6) | individual line | ✅ day 40 (z ≈ 44.7) | ❌ 0 of 12 | 1 |
| Isolation Forest | entity-day aggregates | ✅ | ✅ 12 of 12 | 115 of 11,462 (~1%) |
The honest read of that last row: ~102 of the 115 flags are normal entity-days (a false-positive rate around 0.9%). The win is not zero noise — it is that the distributed attack is visible at all. Every one of the 12 merchant-133 days that a fixed threshold never noticed is in the alert queue, waiting for a human.
How we can do better
- Reconcile continuously, not weekly. Stream-match internal ledger lines against partner statements as they settle. The NCBA fraud ran eight days before the weekly match; continuous matching compresses that window to hours.
- Monitor velocity on identities. One contractor session creating 70 accounts in eight days is a velocity outlier before a single transaction fires. Track account-creation and session rates per operator, not just money movement.
- Aggregate per entity, not per line. Flutterwave’s ₦11B stayed under trigger limits because the limits were per-deposit. Rolling per-entity windows (hourly/daily sums and counts) make distribution itself the anomaly.
- Use unsupervised models with human-in-the-loop review. Isolation Forest needs no labels and finds patterns you have not named yet — but pair it with a triage queue and a scoring layer, and tune
contaminationagainst your real alert budget. - Measure your false-positive rate like a revenue KPI. Danske Bank cut false positives by 50% with ML and reallocated half its fraud-detection unit to higher-value work. An FP metric forces the team to optimize signal, not just add rules.
- Watch for drift with CUSUM on control totals. Small daily mismatches between your ledger and the counterparty’s accumulate into a detectable signal long before the weekly break appears.
- Red-team your thresholds quarterly. Replay simulated distributed attacks — the pattern above — through the full detection stack and see whether they would have fired.
Key takeaways
| Lesson | Example |
|---|---|
| Reconciliation is the truth detector, but it lags | NCBA caught at end-of-week, Ksh 57.5M gone |
| Fixed per-line thresholds are gameable | Flutterwave ₦11B, deposits kept below trigger limits |
| Change the unit of analysis to beat distribution | Per-entity-day aggregates catch what lines hide |
| Unsupervised ML makes the invisible visible | Isolation Forest: 12/12 distributed days flagged |
| FP rate is a management metric | Danske: 1,200 FPs/day → 50% cut, unit reallocated |
References
- NCBA Bank Rwanda ghost-account fraud (Jun 2025) — kenyainsights.com, 254news.co.ke, businessdailyafrica.com
- Flutterwave: ₦11B moved over 4 days, kept below trigger limits — TechCabal, May 16, 2024
- Danske Bank fights fraud with deep learning and AI — Teradata case study — up to 1,200 FPs/day, 99.5% not fraud
- Danske Bank turns to Teradata for AI-powered fraud detection — 50% FP reduction (Nadeem Gulzar, head of advanced analytics)
- IsolationForest — scikit-learn documentation