Fraud Went Mobile: Analytics Lessons from the CBK's 2024 Fraud Numbers
The regulator’s table is an analytics dataset
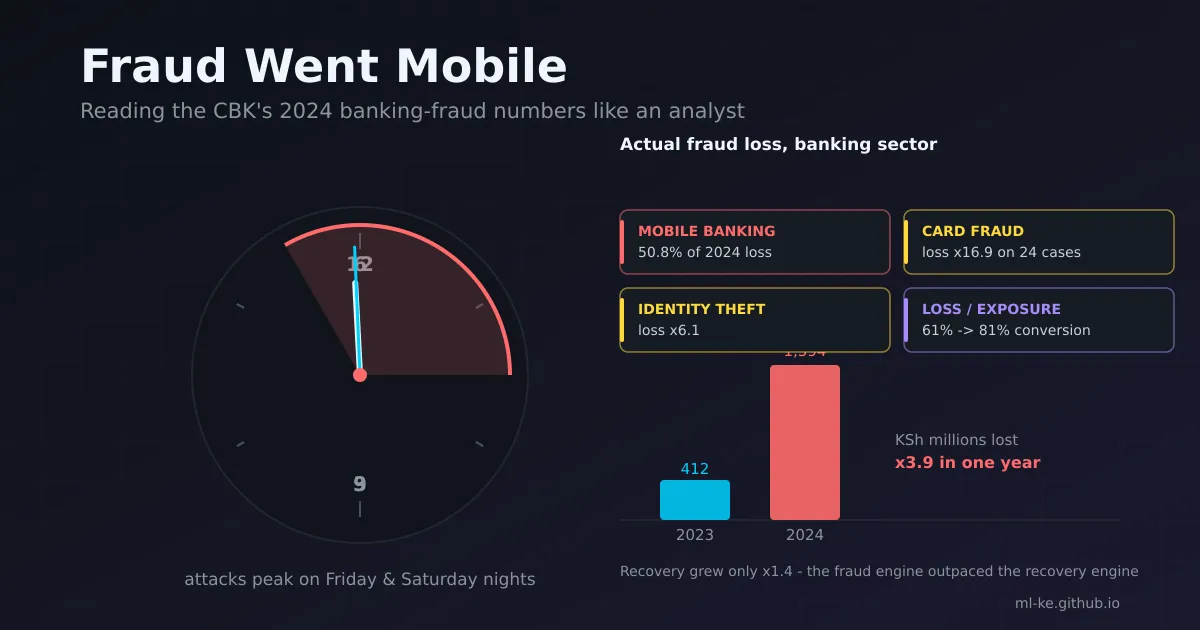
Every year the Central Bank of Kenya publishes the Financial Sector Stability Report, and Table 14 — “Fraud cases and Exposure” — tells the sector’s fraud story in six rows. The 2024 edition, released in September 2025, deserves a close read because the story is not the obvious one: reported cyber-fraud cases in banking more than doubled from 173 to 353, the amount exposed grew from KSh 680.9 million to KSh 1,963.2 million, and the actual loss nearly quadrupled from KSh 412.5 million to KSh 1,594.4 million.
Why this matters to an analytics team Totals hide the signal. The same table that shows “fraud went up” also shows where it went up — which channels, which fraud types, which ratios. Losses did not grow evenly; they changed shape. The mix, the conversion rate and the severity per case tell you which controls broke and which ones work.
The second read is more interesting than the first: exposure grew 2.9×, loss grew 3.9×, recovery only 1.4×. The gap is the real story — the fraud engine scaled faster than the recovery engine, so losses are a rising percentage of attempts the banks fail to claw back.
Where the money actually moved
Table 14 splits the totals into six fraud types (mobile banking, online banking, card, identity theft, computer fraud, internet scam — full rows in the script below). Three observations an analytics lead should act on:
Mobile banking became the fraud channel. Its loss rose 344%, from KSh 182.4 million to KSh 810.7 million, lifting its share of all losses from 44.2% to 50.8% — just over half of everything lost. Business Daily’s coverage adds the when: thefts clustered on Friday and Saturday nights, fraudsters tricking revellers — typically millennials — into revealing passwords while their wallets were in use. Fraud follows product usage; mobile is where customers live at midnight, so that is where the fraud went.
Card fraud exploded on very few cases. Loss rose 16.9× (KSh 15.6m → KSh 263.3m) across just 24 cases — KSh 11.0 million per case, the highest severity of any channel. That shape — a handful of compromised card batches or merchant breaches — barely registers on a count-based dashboard and screams on a value-based one.
Online-banking cases multiplied 19 → 106 (×5.6) while losses barely moved (×1.1). Mass, low-value attempts that mostly failed — the fingerprint of attacks being blocked at scale. Rising case counts with flat losses is the one “good” signal in the table: detection caught up on that channel.
The ratio the headline misses: loss ÷ exposure
The CBK distinguishes amount exposed (what fraudsters tried to move) from actual loss (what was not recovered). The ratio between them — the conversion rate — is the most under-read column in the table:
- Sector-wide conversion rose from 60.6% in 2023 to 81.2% in 2024: four of every five shillings attempted were lost for good.
- Identity theft flipped from 14.6% to 97.9%. In 2023, identity attempts were the single largest exposure category (KSh 223.7m) yet only KSh 32.6m was lost — controls blocked ~85% of attempts. In 2024 attempts actually fell (KSh 203.4m exposed) but KSh 199.1m was lost. Attacks got better, or controls got worse; either way this is the sharpest control-failure signal in the report.
- Card went the other way: 96.6% → 59.9%. Card exposure jumped 27× (KSh 16.1m → KSh 439.4m) but roughly 40% of it was clawed back. Card fraud has a recovery machinery the other channels lack — issuer reversals, chargebacks, scheme-level rules. When fraudsters moved to mobile and identity channels, they moved out of reach of reversal.
The strategic insight: attackers migrate toward channels with no undo button. Mobile pushes, SIM swaps and identity fraud end in irreversible outbound transfers; card fraud ends in a dispute the issuer can win. Loss-to-exposure by channel is a map of where your recovery tools exist — and where they do not, the detection bar has to be higher.
And note the severity compound: cases doubled (173 → 353) while average loss per case rose from KSh 2.38m to KSh 4.52m (×1.9) — twice the frequency at nearly twice the severity.
Recomputing the table (the whole analysis in one script)
Everything above is arithmetic on Table 14 as published — no assumptions, no simulated data. The script below reproduces the channel table and derives every ratio quoted in this post:
1
2
3
4
5
6
7
8
9
10
11
12
13
14
15
16
17
18
19
20
21
22
23
24
25
26
27
28
29
30
31
32
33
34
35
36
37
38
39
40
41
42
43
44
# CBK Financial Sector Stability Report 2025, Table 14: Fraud cases and Exposure
# All amounts in KSh '000s as published by the CBK.
rows = {
    "Mobile banking": (78, 146, 184215.1, 981723.6, 182410.3, 810679.5),
    "Online banking": (19, 106, 110015.1, 129125.6, 106206.4, 111834.4),
    "Card fraud":     (21,  24,  16148.1, 439440.0,  15597.1, 263288.5),
    "Identity theft": (37,  56, 223721.8, 203377.4,  32616.8, 199082.3),
    "Computer fraud": (11,  12, 145961.2, 203413.0,  74840.3, 203394.9),
    "Internet scam":  ( 7,   9,    797.7,   6074.9,    797.7,   6073.8),
}
total = ("All channels", 173, 353, 680859.0, 1963154.3, 412468.6, 1594353.4)

def conv(lost, exposed):
    return 100.0 * lost / exposed

def ksm(ksh000s):
    return ksh000s / 1000.0

print(f"{'channel':<15}{'cases 23':>8}{'cases 24':>8}"
      f"{'lost23':>9}{'lost24':>9}{'loss x':>7}{'conv23':>7}{'conv24':>7}")
for name, (c23, c24, e23, e24, l23, l24) in rows.items():
    print(f"{name:<15}{c23:>8}{c24:>8}{ksm(l23):>9.1f}{ksm(l24):>9.1f}"
          f"{l24 / l23:>7.1f}{conv(l23, e23):>6.1f}%{conv(l24, e24):>6.1f}%")

c23, c24, e23, e24, l23, l24 = total[1:]
print(f"\n{'TOTAL':<15}{c23:>8}{c24:>8}{ksm(l23):>9.1f}{ksm(l24):>9.1f}"
      f"{l24 / l23:>7.2f}{conv(l23, e23):>6.1f}%{conv(l24, e24):>6.1f}%")

print(f"""
Cases:          {c23} -> {c24}  (+{(c24 / c23 - 1) * 100:.0f}%)
Amount exposed: KSh {ksm(e23):.1f}m -> KSh {ksm(e24):.1f}m  (x{e24 / e23:.1f})
Actual loss:    KSh {ksm(l23):.1f}m -> KSh {ksm(l24):.1f}m  (x{l24 / l23:.1f})
Recovered:      KSh {ksm(e23 - l23):.1f}m -> KSh {ksm(e24 - l24):.1f}m  (x{(e24 - l24) / (e23 - l23):.1f})

Loss per case:       KSh {ksm(l23) / c23:.2f}m -> KSh {ksm(l24) / c24:.2f}m  (x{(l24 / c24) / (l23 / c23):.1f})
Mobile share of loss: {100 * rows['Mobile banking'][4] / l23:.1f}% of 2023 -> {100 * rows['Mobile banking'][5] / l24:.1f}% of 2024
Loss/exposure (conversion): {conv(l23, e23):.1f}% of attempts became losses in 2023
                            {conv(l24, e24):.1f}% in 2024

Identity-theft conversion: {conv(rows['Identity theft'][4], rows['Identity theft'][2]):.1f}% (2023)
                           -> {conv(rows['Identity theft'][5], rows['Identity theft'][3]):.1f}% (2024)
Card conversion:           {conv(rows['Card fraud'][4], rows['Card fraud'][2]):.1f}% (2023)
                           -> {conv(rows['Card fraud'][5], rows['Card fraud'][3]):.1f}% (2024)
""")
Output (Python 3.11, stdlib only):
1
2
3
4
5
6
7
8
9
10
11
12
13
14
15
16
17
18
19
20
21
22
23
24
channel        cases 23cases 24   lost23   lost24 loss x conv23 conv24
Mobile banking       78     146    182.4    810.7    4.4  99.0%  82.6%
Online banking       19     106    106.2    111.8    1.1  96.5%  86.6%
Card fraud           21      24     15.6    263.3   16.9  96.6%  59.9%
Identity theft       37      56     32.6    199.1    6.1  14.6%  97.9%
Computer fraud       11      12     74.8    203.4    2.7  51.3% 100.0%
Internet scam         7       9      0.8      6.1    7.6 100.0% 100.0%

TOTAL               173     353    412.5   1594.4   3.87  60.6%  81.2%

Cases:          173 -> 353  (+104%)
Amount exposed: KSh 680.9m -> KSh 1963.2m  (x2.9)
Actual loss:    KSh 412.5m -> KSh 1594.4m  (x3.9)
Recovered:      KSh 268.4m -> KSh 368.8m  (x1.4)

Loss per case:       KSh 2.38m -> KSh 4.52m  (x1.9)
Mobile share of loss: 44.2% of 2023 -> 50.8% of 2024
Loss/exposure (conversion): 60.6% of attempts became losses in 2023
                            81.2% in 2024

Identity-theft conversion: 14.6% (2023)
                           -> 97.9% (2024)
Card conversion:           96.6% (2023)
                           -> 59.9% (2024)
The part the table cannot see: insiders
Table 14 classifies external attack types — and that is its blind spot. TechCabal’s September 2025 investigation into the same CBK data reported that most actual fund losses point to insider-assisted fraud: shadow “call-centre” operations in Nairobi estates like Utawala and Ruiru where bank staff monitor accounts and tip off syndicates, money pushed to mule accounts within minutes and laundered through mobile-money wallets, aimed at the biggest retail banks (Equity, KCB, Co-operative — a combined customer base above 50 million). A Banking Fraud Investigations Unit officer told TechCabal the operations “design for scale” and hide in the noise of millions of daily transactions.
The 2024 disclosures corroborate it. Business Daily reported KCB Group fired 34 employees over fraud and negligence (25 in Kenya, nine in Rwanda) after attempts put KSh 212.9 million at risk, Absa Kenya blocked KSh 306 million of fraud while losing KSh 169 million, and Equity’s staff audit produced show-cause letters for more than 1,200 employees — with the CBK’s own supervision report noting banks now use AI to monitor employees for fraud. This is the NCBA failure mode: a contractor with legitimate backend access drained KSh 57.5 million through 70 ghost accounts over eight days before end-of-week reconciliation caught it (our anatomy of that incident). Insider-assisted fraud looks normal to channel analytics — valid credentials, plausible times, amounts under thresholds — so it needs access analytics, not just transaction analytics. Losses quadrupling while reported cases stay in the hundreds is consistent with a few well-connected actors, not a mass of external hackers.
How we can do better
- Track the mix weekly, not the total monthly. Mobile went from 44% to 51% of losses in a year; identity loss grew ×6. A share-of-loss dashboard by channel/type catches the shift months before the annual report does — and any category whose conversion moves more than a few points is a broken control (identity’s 14.6% → 97.9% flip is the template).
- Make loss ÷ exposure a KPI. It separates “attackers tried more” (exposure up, conversion flat) from “our recovery stopped working” (conversion up) — the first needs detection, the second needs reversal capability, where Kenyan banks are losing ground fastest.
- Value-weight your alerting. Two × more cases at two × severity means count thresholds silently double their miss-cost. Weight by per-case exposure and trend severity-per-case separately.
- Add time-of-week context. Friday/Saturday-night mobile sessions are the documented attack window: step-up authentication on late-night logins and velocity limits on outbound mobile transfers to fresh wallets hit exactly where fraudsters chose to operate.
- Give recovery its own pipeline. Card claws back ~40%, identity ~2% — that is where reversal machinery exists. For irreversible channels (mobile push, SIM swap) the control must be upstream: cooling-off delays, beneficiary vetting, SIM-change alerts. After the money moves, it is gone.
- Pair channel analytics with insider signals. Valid-credential fraud will not look anomalous in transaction streams. Employee-access analytics, agent-touchpoint monitoring and staff audits are the complement — see our playbook on insider and privileged access.
The bottom line
The CBK’s 2024 numbers are the best free fraud dataset a Kenyan fintech analytics team has — worth more than a headline. Read as a mix, they say: losses quadrupled, mobile is now over half of them, attacks are fewer-but-bigger and better at converting, fraud moved to channels with no undo button — and the insider channel is invisible to the taxonomy. Read that way, the report stops being a scorecard and becomes a map of where the next controls have to go.
References
- Central Bank of Kenya — Financial Sector Stability Report 2024, Table 14 (PDF)
- Central Bank of Kenya — Release notice: Financial Sector Stability Report 2024
- Business Daily — Hackers steal Sh1.59 billion from Kenya bank customers
- Business Daily — KCB Group fires 34 workers in fraud, negligence crackdown
- TechCabal — CBK blames hackers for mobile banking fraud, but insiders may be the real threat
- TechTrends KE — Cyber fraud in Kenyan banks surges to Sh1.59 billion
- Money254 — Kenyans lose Ksh1.59 billion to fraudsters targeting banks