Four Times the Fields: The Delivery Stack Behind the Google–Gates Farmer AI Plan
Introduction
The announcement, in one line On 18 September 2026 the Gates Foundation and Google said they will scale AI agricultural tooling from an existing reach of 50 million smallholder farmers to 200 million across Sub-Saharan Africa and South Asia, backed by $100 million in combined funding and dedicated engineering support from Google researchers.
This post is not about whether that pledge is good. It is about what has to be built for a number like 200 million to mean anything — and about which parts of the stack already exist, because a good deal of it does.
If you want the funding arithmetic behind the wider Gates AI commitment, we covered how to read the Goalkeepers numbers earlier this month. Here the subject is the delivery layer: satellite mapping, language coverage, and the arithmetic of a four-fold scale-up.
What was announced, in the announcement’s own numbers
The Gates Foundation release and Google’s own post describe three pillars rather than one product.
| Pillar | What it actually is | Named partners |
|---|---|---|
| Supporting local ecosystems | Funding, compute and technical support to regional researchers, “keeping talent, data governance, and intellectual property anchored in the regions where these solutions are developed” | Wadhwani AI, Digital Green (India) |
| Micro-climate precision | Integrating AI forecasting into TomorrowNow, an operational climate platform co-funded by the Gates Foundation, the UK’s FCDO and Google.org | TomorrowNow |
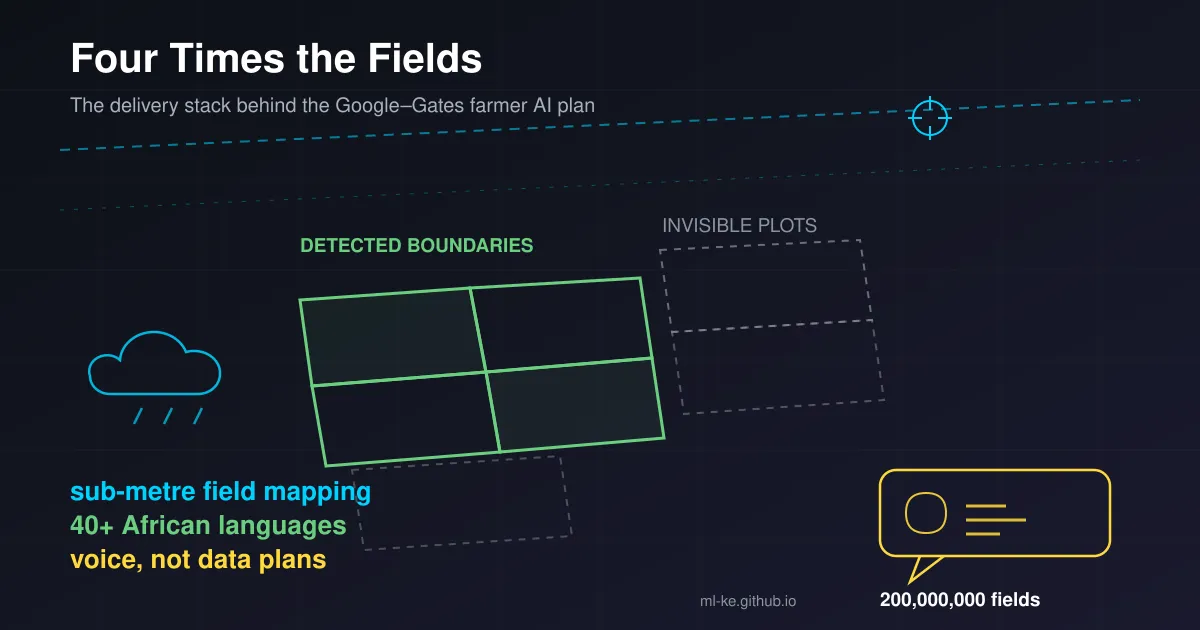
| Making smallholder farms visible | Agricultural Understanding Platform — a foundation-model suite to map field boundaries at sub-meter resolution and monitor crops through the season | CGIAR centres, agricultural ministries |
| Language and crop access | Open-source speech and text datasets across 40+ African languages; CGIAR work on drought-, heat- and disease-tolerant varieties | Masakhane Research Foundation, Digital Umugunda |
Two framing numbers from the same release are worth keeping in view, because they are why the visibility problem is hard and not merely tedious:
- Smallholder farms produce nearly 35% of the world’s food across more than 500 million farms, most smaller than two hectares.
- They account for an estimated 85% of agricultural holdings worldwide, and their “small and irregular plots can be difficult to identify using conventional satellite imagery.”
That last sentence is the whole engineering problem in one line, and it has a consequence the release spells out: if a plot cannot be identified, the farmer struggles to verify land and crop cycles when applying for government programmes, insurance or subsidised inputs.
The hard part is the map, not the model
The forecasting model is the part everyone talks about; the map is the part that has to be right first. The Gates release names the Agricultural Land Use (ALU) data layer, already among the most-accessed layers on Google Earth and part of Earth AI. It spans India, Malaysia, Vietnam and Indonesia today, with deployments underway in Kenya, Uganda, Ghana, Rwanda, Zambia and Nigeria.
That African ramp is not starting from zero. As The Hindu BusinessLine reported in September, partners are already building on the ALU and AMED APIs:
- Terrastack (spun out of IIT Bombay work on land records) has a spatial intelligence platform that “has mapped over 140 million hectares of farmland, reducing the need for physical field visits” — the figure is Terrastack’s, built on Google’s APIs, not a Google deployment count.
- CarbonFarm uses the ALU API and Gemini to automate field-level delineation, aiming at 2 million hectares of low-carbon rice by 2030, with farmers photographing fields and using generated boundaries to estimate water levels.
- Telangana is piloting Krishivaas, which generates hyperlocal advisories on crop stress, crop-specific weather and localised pest outbreaks.
- Google.org supports the FAO’s geoAI4stats effort, which plans to integrate ALU and AMED into FAO’s CROPGRIDS repository.
One caveat from that reporting deserves more attention than it usually gets: Google’s DeepMind lead described the existing system as “looking backwards” — identifying what was grown years ago for downstream applications, with the model’s own confidence attached, rather than predicting the season ahead. The forecasting promise in the new announcement therefore rests on TomorrowNow, a different component with a different track record. If you are evaluating any claim about AI-driven yield prediction in East Africa, ask which of those two systems produced it.
A useful test for any “AI map” pitch Separate identification (what was in this field, at this confidence, last season) from prediction (what will happen next season). Papers and press releases often blend them into one capability.
The last mile is a language problem
200 million farmers will not read an API response. The release commits to open-source speech and text datasets covering more than 40 African languages, distributed through regional networks including the Masakhane Research Foundation and Digital Umugunda — and cryptobriefing’s write-up notes the delivery design: mobile phones, voice interfaces and chat tools in local languages, aimed at people who may not be literate or carry a data plan.
Kenyan builders have a reference point for how hard that last constraint is. Offline-capable African-language translation is a solved-ish problem only at very specific weight budgets, which is what our post on the TranslatePSY and AfriSLM releases measured. Voice-first advisory for a farmer on a 2G phone is a harder target than a translation app with a downloaded model — and the datasets, not the user interface, are the licence to attempt it.
Inside the advisory loop
The most useful description of what an advisory has to contain comes from the India deployment, not the announcement. Telangana’s Krishivaas pilot generates “actionable, hyperlocal advisories on crop stress, crop-specific weather patterns and localised pest outbreaks”. Compare that with what a general-purpose model will happily produce when asked about a farm: a paragraph of plausible agronomy with no field reference, no crop stage and no confidence.
The gap between those two things is the delivery engineering, and it is unglamorous:
| Layer | What breaks at 200 million users | What has to be built |
|---|---|---|
| Weather input | Regional forecasts do not resolve a two-hectare plot | Micro-climate downscaling feeding TomorrowNow, with the model’s confidence surfaced per advisory |
| Message channel | Literacy, a smartphone and a data plan cannot be assumed | Voice interfaces and chat on basic phones, per the delivery design cryptobriefing describes |
| Advisory text | Crop-stage guidance is wrong at the wrong growth stage | Crop-cycle awareness from the mapping layer, so an advisory is timed to the season |
| Trust | A wrong advisory costs a harvest, and word travels faster than any retraction | Provenance on every recommendation — which system produced it, and how sure it is |
That last row is where the “looking backwards” point earns its keep. Google’s existing crop identification supplies historic ground truth with stated confidence; advisory systems that silently blend identification and forecasting inherit all the credibility of one and none of the caveats of the other. If you are the one building the last mile in Kenya, publishing the confidence value next to the advice is not a nicety — it is the difference between a tool farmers keep using and one they abandon after the first bad season.
The other half of the $100M is seeds, not software
One line in the release is easy to skim past: the $100 million is supporting “regional research and infrastructure, including work with CGIAR to accelerate the development of crop varieties designed to withstand drought, heat, and disease”.
That is the slow half of the plan, and it is the half that outlives any model. A breeding pipeline takes years per cycle; a mapping layer can tell you where a drought-tolerant variety will face the stress it was bred for, which is a targeting problem rather than a modelling one. Pair the two and you get something more durable than an advisory app: variety recommendations grounded in field boundaries rather than administrative regions.
For Kenyan builders the practical consequence is about positioning. Advisory software is the fast half — it can ship this year against APIs that already exist, and it competes on language coverage and channel design. Seed and variety targeting is the slow half, funded and coordinated through CGIAR and agricultural ministries, and it is where a small team with agronomy partnerships can add real value rather than competing with a chatbot.
The arithmetic of a four-fold scale-up
This next block is arithmetic on the announcement’s own numbers, run so the size of the ask is concrete. It is not a forecast: the release says “multi-year roadmap” and never states a horizon, so the growth rates below are conditional on a horizon we chose.
1
2
3
4
5
6
7
8
9
10
11
12
13
# Arithmetic on the announced numbers - not a forecast.
targets = [50_000_000, 200_000_000]
print(f"scale-up factor: {targets[1]/targets[0]:.0f}x")
for years in (3, 4, 5):
    cagr = (targets[1] / targets[0]) ** (1 / years) - 1
    per_day = (targets[1] - targets[0]) / (years * 365)
    print(f"{years}y horizon -> CAGR {cagr*100:5.1f}%  |  {per_day:,.0f} new farmers/day")

farms, farms_lt_2ha = 500_000_000, 200_000_000
print(f"reach as share of the world's smallholder farms: {farms_lt_2ha/farms*100:.0f}%")
print(f"land ceiling at 2 ha/farm: {farms_lt_2ha*2/1_000_000:.0f}M ha = {farms_lt_2ha*2/100/1_000_000:.2f}M km2")
alu_live, alu_ramp = ["India", "Malaysia", "Vietnam", "Indonesia"], ["Kenya", "Uganda", "Ghana", "Rwanda", "Zambia", "Nigeria"]
print(f"ALU layer: {len(alu_live)} countries live, {len(alu_ramp)} deploying = {len(alu_live)+len(alu_ramp)} total")
1
2
3
4
5
6
7
scale-up factor: 4x
3y horizon -> CAGR  58.7%  |  136,986 new farmers/day
4y horizon -> CAGR  41.4%  |  102,740 new farmers/day
5y horizon -> CAGR  32.0%  |  82,192 new farmers/day
reach as share of the world's smallholder farms: 40%
land ceiling at 2 ha/farm: 400M ha = 4.00M km2
ALU layer: 4 countries live, 6 deploying = 10 total
Read the second column as the operational load, not as marketing. Adding roughly 100,000 farmers a day for four years does not mean 100,000 new model calls; it means 100,000 new advisory relationships, each of which eventually needs localised weather, crop-stage guidance and some channel to ask a follow-up question. The reach target is 40% of the world’s smallholder farms, a ceiling of about 4 million km² of farmland if every field sits at the two-hectare cap — which is precisely why the map has to be automated rather than surveyed.
What this means if you build in Kenya
Kenya is one of the six countries where the ALU layer is being deployed next, and the $100 million includes CGIAR crop-breeding work, so the surface area for local builders is real rather than aspirational. Three practical reads:
| Question | Practical read |
|---|---|
| Can I use the maps today? | ALU ships through Earth AI and the ALU/AMED APIs; Kenya deployments are described as “underway”, so treat coverage as a pilot, not a national layer. Terrastack’s map is a partner’s product, not an open dataset. |
| Where is the buildable gap? | Voice and advisory delivery in 40+ languages. The datasets are being funded; the applications are not. A field-level advisory app that works on a slow connection is the missing middle. |
| What should I verify before betting on it? | Data-governance terms. The release states the goal of anchoring “data governance, and intellectual property” regionally — that is a stated intention, not a licence. Read the actual terms before you build a business on mapped field boundaries. |
| Who coordinates? | The AI Collaborative: Food Security is named as the learnings-sharing body; Google.org support for FAO’s geoAI4stats is one funded route into the statistics side. |
Three things worth doing this quarter, in order:
- Check coverage before designing anything. Query the ALU/AMED layers for your area of interest and treat what comes back as pilot coverage, not a national layer. If your target district is not mapped, design for missing boundaries rather than assuming them.
- Measure your channel, not your model. Count what fraction of your users are on feature phones, what fraction will not read a text message in English, and how long a voice advisory can be before it stops being actionable. Those numbers, not benchmark scores, decide whether an advisory product survives contact with a real farming season.
- Pick a language a dataset already covers. The announcement funds open speech and text datasets for 40+ African languages; building on a funded language beats building a dataset and a product at the same time. The Masakhane Research Foundation and Digital Umugunda are the named networks to follow for release announcements.
Key takeaways
| Takeaway | Detail |
|---|---|
| The announcement is a delivery plan, not a new model | Three pillars: local ecosystem funding, micro-climate forecasting via TomorrowNow, and sub-meter field mapping via the Agricultural Understanding Platform |
| The mapping problem is the bottleneck | 85% of agricultural holdings worldwide are smallholder plots whose small, irregular shapes resist conventional satellite imagery |
| Kenya is in the next deployment wave | ALU ramps into Kenya, Uganda, Ghana, Rwanda, Zambia and Nigeria alongside four countries already live |
| Language is the delivery channel | Open speech and text datasets for 40+ African languages, with Masakhane Research Foundation and Digital Umugunda as named networks |
| Separate identification from prediction | Existing ALU-based systems identify historical crops with confidence; forecasting is a different component with a shorter track record |
| The scale is four-fold | 50M to 200M is 40% of the world’s smallholder farms and, at four years, about 100,000 new farmer relationships a day |
References
- Gates Foundation and Google to Bring AI Resources to 200 Million Farmers Across the Global South — Gates Foundation, 18 September 2026
- Google and the Gates Foundation to bring AI resources to 200 million farmers across the Global South — Google, 22 September 2026
- Google launches AI project to increase farm productivity, climate resilience — The Hindu BusinessLine, on ALU/AMED, Terrastack, CarbonFarm and geoAI4stats
- Gates Foundation and Google direct $100M to AI tools for smallholder farmers — the delivery-design detail (voice, chat, no data plan requirement)
- Google and the Gates Foundation expand AI tools to 200 million farmers across the Global South — independent summary of the funding split
Related posts
- AI for Agriculture — the earlier tour of crop disease detection and yield prediction
- The $1 Billion AI Bet: What the Goalkeepers Report Funds — how to read the funding numbers rather than the headline
- Nineteen Languages, One Download — what offline African-language models actually cost
- Mobile-First AI — designing for the phone farmers already carry