The Money Stopped Moving: What Fintech Outage Post-Mortems Actually Measure
The status page said 30 minutes
On Friday 1 June 2018 at 14:35, card payments across Europe started failing. Visa Europe’s letter to the UK Treasury Committee records the sequence: a switch in a primary data centre suffered a “very rare, partial failure”, and the secondary site — built to carry 100% of European traffic — could not take over. Worse, the failing primary kept trying to synchronise messages with the healthy site, so the backlog piled up at the backup and slowed it down further (Guardian, FStech).
Service was not fully restored until 00:45 the next morning — roughly ten hours, in which 5.2 million transactions failed: 2.4 million in the UK, 2.8 million in the rest of Europe, affecting 1.7 million UK cards, or 10.4% of the cards in use.
The key concept Downtime minutes are a proxy for the wrong thing. An availability probe answers “can I reach you?” A payments incident asks “what value did you strand, how long were you degraded, and how much of it never came back?” Those are four different numbers, and only the last one shows up in customer complaints.
Four outages, four failure regimes
| Incident | What the status page said | What the record shows |
|---|---|---|
| Visa Europe, 1 Jun 2018 | Service disruption; card payments intermittently declined | 5.2M failed transactions over ~10 hours; failover to the second data centre was blocked, and the primary’s sync attempts flooded the secondary (Guardian, FStech) |
| TSB, Apr–Dec 2018 | IT migration issues; some services affected | All branches and a significant proportion of its 5.2M customers hit; business-as-usual only in December 2018; £32.7M customer redress; £48.65M fine (FCA £29.75M + PRA £18.9M) (FCA) |
| M-Shwari (Safaricom + NCBA), Nov 2025 and Feb 2026 | “Technical issue at our partner”; services restored | Nov 2025: a 3+ day outage where balances showed zero; access “restored” Sunday while account reconciliation was still ongoing (TechCabal). Feb 2026: a ~36-hour outage, again ending in a reconciliation queue, with users reporting hanging transactions at 10 p.m. on the day service was declared restored (tech-ish, K24) |
| AWS us-east-1, 19–20 Oct 2025 | Elevated error rates in one region | A latent race condition in DynamoDB’s automated DNS management produced an incorrect empty DNS record that automation failed to repair; the automation was disabled worldwide as the fix, and some customers saw issues for up to 15 hours (InfoQ, Forbes) |
Three patterns repeat across those four. Redundancy was part of the failure: Visa’s backup did not fail to engage, it was congested by the primary it existed to replace, and AWS’s global fix was switching off its own DNS automation. The incident ends when the balance is right, not when the endpoint returns 200: TSB’s data migrated fine and business-as-usual still took until December, while both M-Shwari incidents ended with “restored” announced mid-reconciliation. And your MTTR cannot beat your provider’s: third-party providers account for about two-thirds of publicly reported outages over nine years, 57% of firms put their last major outage above $100,000, and 1 in 5 above $1 million (Uptime Institute, BusinessWire).
Which clock are you measuring?
Regulators no longer accept “we detected it when customers called”. DORA requires an initial notification within 4 hours of classifying an incident as major, and no later than 24 hours from becoming aware, an intermediate report at 72 hours and a final one at one month (EBA). In Kenya, the CBK’s Guidance Note on Cybersecurity requires institutions to report incidents with a significant adverse impact within 24 hours, plus quarterly reporting (CBK, Inside Privacy). And under the FCA’s PS21/3, firms were required to have mapped and tested their ability to stay within impact tolerances for each important business service no later than 31 March 2025 (FCA).
Every one of those clocks starts at awareness or classification. A detection lag of 90 minutes is not a dashboard aesthetic — it is the difference between a reportable incident and a missed deadline.
Turning the payment stream into post-mortem numbers
Use the authorisation stream itself, not the uptime probe: bin it (15 minutes is a good stride), learn the day’s expected shape from healthy bins, and compute four things:
- Deficit integral — sum of (expected − actual approvals) across the degraded window: the stranded value, in transactions.
- Degraded vs hard-down window — time below baseline versus time near zero.
- Detection latency by detector class — when a level threshold fires versus a sequential test.
- Retry recovery ratio — how many stranded approvals reappear as successful retries, and how long the drain takes.
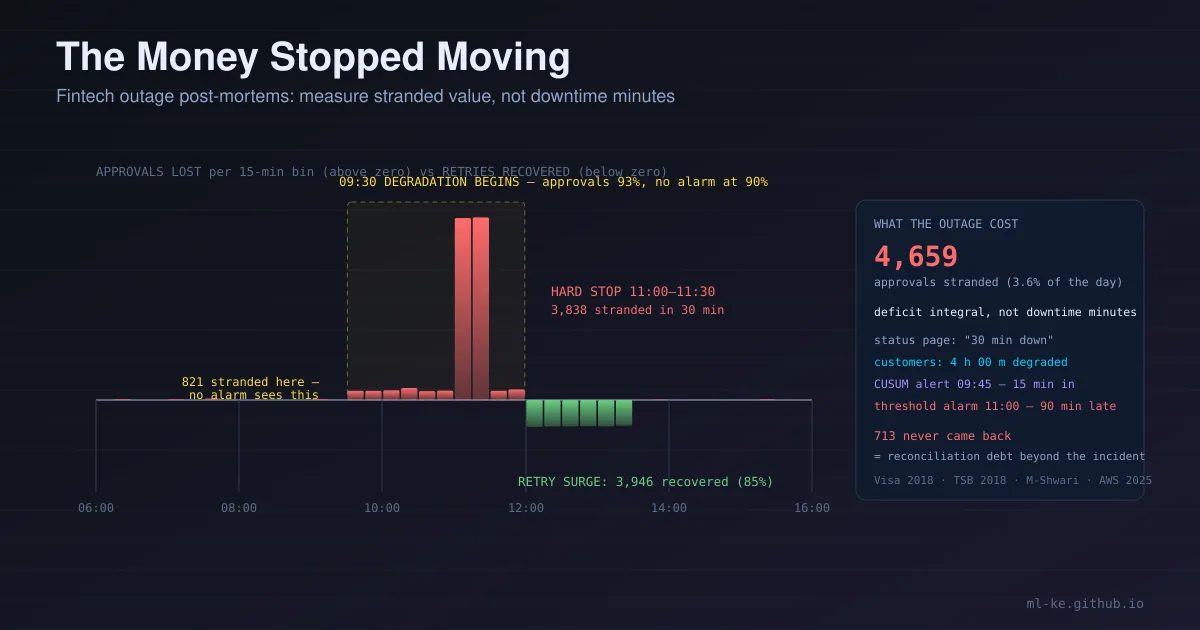
The script below simulates a day (96 bins, diurnal demand, a two-hour brownout at 93% that never trips a 90% threshold, and a 30-minute hard stop) and measures it the way a post-mortem should.
1
2
3
4
5
6
7
8
9
10
11
12
13
14
15
16
17
18
19
20
21
22
23
24
25
26
27
28
29
30
31
32
33
34
35
36
37
38
39
40
41
42
43
44
45
46
47
48
49
50
51
52
53
54
55
56
57
58
59
60
61
62
63
64
65
66
67
68
69
70
71
72
73
74
75
76
77
78
79
80
81
82
83
84
85
86
87
88
89
90
91
92
"""Post-mortem metrics for a payment-authorisation brownout. Standard library only."""
import math
import random
import statistics

random.seed(7)

BINS = 96                        # one day in 15-minute bins
ONSET, RECOVER = 38, 48          # 09:30 degradation begins, 12:00 service restored
HARD_FAIL = (44, 45)             # 11:00-11:30 approvals collapse
BROWNOUT_RATE = 0.93             # degraded but "up" - stays above any 90% threshold
HARD_FAIL_RATE = 0.02
STEADY_RATE = 0.982              # steady-state approval rate
RETRY_START, RETRY_END = 48, 54  # failed customers retry for 90 minutes after restoration

def base_attempts(i):
    """Authorisations attempted per 15-min bin: diurnal, quiet overnight, peak mid-morning."""
    return int(round(900 + 1100 * max(0.0, math.sin(math.pi * (i - 8) / 68))))

def approval_rate(i):
    if i in HARD_FAIL:
        return HARD_FAIL_RATE
    if ONSET <= i < RECOVER:
        return BROWNOUT_RATE
    return STEADY_RATE

attempted, approved = [], []
for i in range(BINS):
    n = base_attempts(i)
    if RETRY_START <= i < RETRY_END:          # retries from customers who failed
        n = int(round(n * 1.35))
    attempted.append(n)
    approved.append(sum(1 for _ in range(n) if random.random() < approval_rate(i)))

# baseline from healthy bins only (incident and retry bins excluded)
healthy = [i for i in range(BINS) if not (ONSET <= i < RETRY_END)]
base_rate = statistics.median(approved[i] / attempted[i] for i in healthy)
sigma = statistics.pstdev([approved[i] / attempted[i] - base_rate for i in healthy])

# expected volume = baseline demand x base rate, so retries appear as surplus
expected = [base_attempts(i) * base_rate for i in range(BINS)]
deficit = sum(max(0.0, expected[i] - approved[i]) for i in range(ONSET, RECOVER))
hard_fail_deficit = sum(max(0.0, expected[i] - approved[i]) for i in HARD_FAIL)

def first_static_alarm(threshold=0.90):
    for i in range(BINS):
        if attempted[i] > 200 and approved[i] / attempted[i] < threshold:
            return i
    return None

def first_cusum_alarm(k=0.5, h=20.0):
    s = 0.0
    for i in range(BINS):
        if attempted[i] <= 200:
            continue
        s = max(0.0, s - (approved[i] / attempted[i] - base_rate) / sigma - k)
        if s > h:
            return i
    return None

static_bin, cusum_bin = first_static_alarm(), first_cusum_alarm()

cum_surplus, normal_bin = 0.0, None
for i in range(RECOVER, BINS):
    cum_surplus += approved[i] - expected[i]
    if normal_bin is None and attempted[i] <= base_attempts(i):
        normal_bin = i

def clock(i):
    return f"{i * 15 // 60:02d}:{i * 15 % 60:02d}"

print(f"steady-state approval rate (median of healthy bins): {base_rate:.4f}")
print(f"residual sigma (healthy bins): {sigma:.5f}")
print(f"attempted: {sum(attempted):,}   approved: {sum(approved):,}")
print(f"stranded approvals (deficit integral): {deficit:,.0f} "
      f"= {deficit / sum(approved) * 100:.1f}% of the day's approvals")
print(f"  brownout bins: {len([i for i in range(ONSET, RECOVER) if i not in HARD_FAIL])}"
      f"   hard-fail bins: {len(HARD_FAIL)}")
print(f"static rate threshold (<90%): first alarm bin {static_bin} ({clock(static_bin)}) "
      f"= {(static_bin - ONSET) * 15} min after degradation began")
print(f"CUSUM (k=0.5, h=20): first alarm bin {cusum_bin} ({clock(cusum_bin)}) "
      f"= {(cusum_bin - ONSET) * 15} min after degradation began")
print(f"share of stranded approvals outside the hard-fail bins: "
      f"{(deficit - hard_fail_deficit) / deficit * 100:.0f}%")
print(f"retry surplus after restoration: {cum_surplus:,.0f} "
      f"({cum_surplus / deficit * 100:.0f}% of the deficit)")
print(f"attempted volume back to baseline at bin {normal_bin} ({clock(normal_bin)}) "
      f"= {(normal_bin - RECOVER) * 15} min after 'restored'")
print(f"never re-attempted inside the window: {deficit - cum_surplus:,.0f} "
      f"({(deficit - cum_surplus) / deficit * 100:.0f}% of stranded approvals)")
print(f"customer-visible window {clock(ONSET)} to {clock(normal_bin)} "
      f"= {(normal_bin - ONSET) * 15} min, vs {len(HARD_FAIL) * 15} min of hard-down")
Run it and the day reports itself:
1
2
3
4
5
6
7
8
9
10
11
12
steady-state approval rate (median of healthy bins): 0.9824
residual sigma (healthy bins): 0.00426
attempted: 138,025   approved: 130,931
stranded approvals (deficit integral): 4,659 = 3.6% of the day's approvals
  brownout bins: 8   hard-fail bins: 2
static rate threshold (<90%): first alarm bin 44 (11:00) = 90 min after degradation began
CUSUM (k=0.5, h=20): first alarm bin 39 (09:45) = 15 min after degradation began
share of stranded approvals outside the hard-fail bins: 18%
retry surplus after restoration: 3,946 (85% of the deficit)
attempted volume back to baseline at bin 54 (13:30) = 90 min after 'restored'
never re-attempted inside the window: 713 (15% of stranded approvals)
customer-visible window 09:30 to 13:30 = 240 min, vs 30 min of hard-down
Read that as an incident review should. The status page would have called this a 30-minute outage. Customers experienced four hours: two hours of quiet degradation, 30 minutes of hard failure, then 90 minutes of retry surge before attempted volume returned to its normal shape. 18% of the stranded approvals landed during the two hours when every level-based dashboard read “up” — 93% approval is comfortably above any static 90% alarm. The CUSUM test on the same data (no model, no ML, one line of state) flagged the shift at 09:45.
And the last line is the one nobody writes into the incident report: 713 approvals were never re-attempted inside the window. That residue is reconciliation debt, and it is the shape of the M-Shwari complaints — money that left an account while the ledger said otherwise, fixed by hand days later. Across seeds 1–7 the CUSUM alarm stays at 09:45 and the recovered share at 84–87%, so none of it depends on one lucky draw.
One honest caveat: the deficit integral understates impact, because attempts fall during a degradation — customers give up, switch rails or pay cash. A post-mortem wanting the true ceiling should add that drop in attempt volume to the deficit rather than count it as lower demand.
How we can do better
| Control | What it catches | How to test it |
|---|---|---|
| End-to-end canary transaction per rail, every 60s (authorise → capture → settle → post) | Correctness failures while every endpoint returns 200 — the TSB and NCBA-Rwanda class | Fail the downstream mock on one rail |
| Two SLIs: availability and approval-success ratio against a business-hours baseline | Silent brownouts (93% approval) that no level threshold sees | Replay a day with a 5% success penalty |
| Degradation detectors (CUSUM/EWMA on the residual) alongside level thresholds | The 90-minute detection lag — and the DORA/CBK clock that starts at awareness | Inject a one-bin shift and time the alert |
| Reconciliation debt as a first-class SLI: unmatched value, entry age, forced sweep after every restart | The “restored but not really” tail | Restart the ledger mid-day and watch the queue drain |
| Correlated-failure drills measuring time to isolate, not time to fail over | Redundancy that amplifies the failure, as at Visa | Fail the primary and its sync path together |
| Dependency map with a per-provider MTTR budget | Your MTTR silently equalling your provider’s (AWS) | Review provider post-mortems beside your own RTO |
| A post-mortem template that reports degraded window, hard-down window, stranded value, recovered share and residual | Duration-based summaries that undercount by design | Compare last quarter’s reports against the authorisation stream |
The one-line version If your post-mortem has no stranded-value number and no reconciliation-debt number, it is a status-page summary, not an incident review.
Key takeaways
| Takeaway | Evidence |
|---|---|
| Measure stranded value, not downtime minutes | 30 minutes of hard-down produced 4,659 stranded approvals and a 4-hour customer-visible window |
| Level thresholds are blind to brownouts above the threshold | 18% of the damage happened at 93% approval, invisible to a 90% alarm |
| Sequential detectors close the detection gap | CUSUM alarms 15 minutes in; the level threshold fired 90 minutes late |
| The incident ends at reconciliation, not restoration | M-Shwari 2025 and 2026; TSB ran to December 2018 |
| Redundancy that shares a failure mode is not redundancy | Visa’s blocked failover; AWS disabling its own DNS automation |
| Detection latency is a compliance metric | DORA’s 4h/24h clocks, CBK’s 24-hour notification, PS21/3 impact tolerances |
References
- Visa admits 5m payments failed over a broken switch — Guardian, 19 June 2018
- ‘Data centre malfunction’ behind Visa outage — FStech, on Visa’s 11-page letter to the Treasury Committee
- TSB fined £48.65m for operational resilience failings — FCA press release
- NCBA works to restore M-Shwari after outage locked customers out of savings — TechCabal, 3 November 2025
- M-Shwari outage locks Kenyans out of funds — tech-ish, 9 February 2026; K24 follow-up
- Race Condition in DynamoDB DNS System: Analyzing the AWS US-EAST-1 Outage — InfoQ, with AWS’s post-event summary
- Uptime Announces Annual Outage Analysis Report 2026 — Uptime Institute
- Joint Technical Standards on major incident reporting — EBA (DORA 4h/24h/72h/1-month clocks)
- Guidance Note on Cybersecurity for the Banking Sector — Central Bank of Kenya
- PS21/3 Building operational resilience — FCA
Related posts
- Reconciliation Analytics: How Data Catches What Dashboards Miss — the integrity failures that stay invisible while uptime is green
- Anomaly Detection for Reconciliation at Scale — the statistical toolkit this post’s detectors borrow from
- Fraud Models Rot Quietly — drift detection, the same residual/CUSUM move applied to model health
- The Middleman Problem — why the partner boundary is where incidents get announced, not resolved
- M-PESA API Security — the integration failures that look like outages to customers