The Evidence Doubled, the Effect Did Not: What 52 Causal Studies Say About AI in Classrooms
Introduction
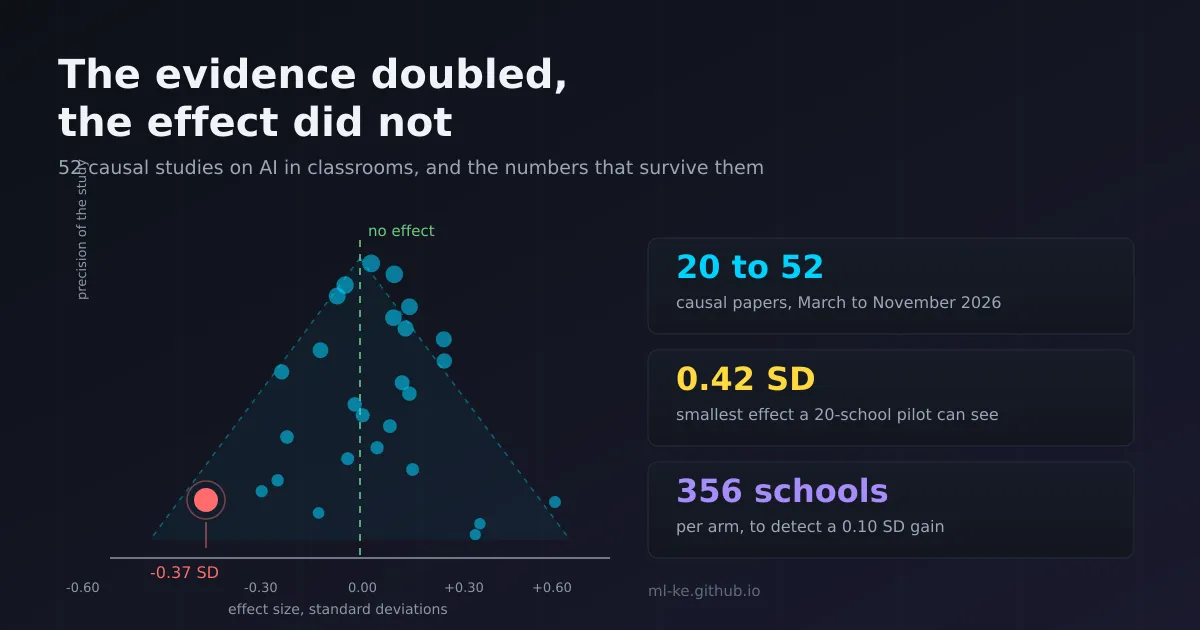
On 10 November the SCALE Initiative at Stanford published its second evidence review on generative AI in K-12 classrooms. The headline count is the easy part: the causal corpus went from 20 papers in March to 52 papers now, an increase of 32 studies published between October 2025 and June 2026.
The harder part is what the extra 32 studies did to the claims. They mostly shrank them. The review’s own summary is that AI is more likely to help when students use it to understand material than when they use it to produce work, and that neither use consistently improves learning. That is a narrower promise than the one most procurement documents are written around, and it arrives with a study table specific enough to check.
Why this is a positive story anyway A field that can say “we ran 52 causal tests and here is where the effect vanishes” is a field that can be trusted with a budget. The review also names the design choices that do seem to work, and it separates them from the ones that only look like they work. Read it as a set of instructions for building the version that survives an unassisted exam.
This is a different post from the one on this blog about teacher-facing deployment, which read a single trial’s design line by line. This one is about the corpus: which findings replicate across countries, which endpoints were actually measured, and how many schools a real effect would need before anyone could see it.
What one institution published this week
The review screens randomized controlled trials and quasi-experimental designs held in the AI Hub for Education’s research repository, then reports what the new evidence does to the old conclusions. The authors are Seth Walker, Lily Fesler, JP Martinez Claeys, Chris Agnew and Susanna Loeb, and the report carries a DOI.
| Item | March 2026 review | November 2026 review |
|---|---|---|
| Strong causal papers | 20 | 52 |
| New papers since last review | - | 32 |
| Publication window covered | through September 2025 | October 2025 to June 2026 |
| New U.S. K-12 student-facing studies | 0 | 5 |
| Fastest-growing area | student-facing AI | student-facing AI |
Two details in that table matter more than the total. First, the growth is concentrated on tools aimed at students rather than at teachers, so the evidence on teacher-facing products is still thin. Second, five new student-facing studies finally ran in U.S. K-12 settings, against none in March. The authors are direct about what that buys: the findings “can provide guidance for education leaders, but should not be treated as broadly generalizable across U.S. K-12 settings.”
So the honest position is that the corpus more than doubled in one release cycle and still does not cover most of the classrooms where these products are being bought.
The split that survives: understanding versus producing
The review’s central finding is a use-mode split, not a product split. Every study below is causal, and the pattern holds across countries with very different school systems.
| Study | Setting and sample | What students did with the AI | Result |
|---|---|---|---|
| Bastani et al. (2025) | Türkiye, about 1,000 high school students, four 90-minute math sessions | Practised with GPT-4, unrestricted or with pedagogical guardrails | Practice scores up 48 percent unrestricted, 127 percent with guardrails; the unrestricted group then scored 17 percent below control on the unassisted exam |
| Kosmyna et al. (2025) | 55 students and staff, essay writing | Wrote an essay with a chatbot, a search engine, or nothing | 83 percent of chatbot users could not quote a line from their own essay, against 11 percent of the other two groups |
| Fischer et al. (2025) | Germany, 334 university students, 25-minute session | Studied economics with restricted access, unrestricted access, or a textbook | Unrestricted beat restricted beat no AI; the ordering was about access, not about understanding |
| Blasco and Charisi (2025) | 122 high school students, Belgium and Spain, one session | Got step-by-step reasoning, a bare solution, a Socratic prompt, or a direct one | Step-by-step reasoning beat solution-only; the Socratic version raised engagement but students rated it less helpful |
| LearnLM team and Eedi (2025) | 165 Year 9 and 10 students, five UK schools, seven weeks | Chatted with a pedagogy-tuned model supervised by expert tutors, versus human tutors | AI-guided tutoring matched human tutoring and transferred better to novel topics |
| Ferman et al. (2021) | Brazil, about 19,000 students across 178 schools, one academic year | Received AI feedback on essays, AI plus human graders, or no feedback | AI feedback improved essay scores; adding human graders did not improve them further |
Take the last column across all six rows before reading any single result. When the AI produces the artifact, the artifact improves and the student does not. When the AI is constrained to explain, prompt or grade, the learning measure moves, and in two of those cases it moves as much as the human comparison arm.
The review puts the same point in one sentence: using AI to offload academic tasks can reduce student learning, and the evidence is more favourable, though still mixed, when students use it explicitly to study.
What the crutch effect actually measured
The Türkiye study is the cleanest demonstration because it has two phases and both were measured. In phase one students solved practice problems with their assigned resource. In phase two they sat an exam with no resources at all.
The gap between the two phases is the whole finding. Access to an unrestricted GPT-4 chat raised practice performance by 48 percent. On the exam that followed, the same students scored 17 percent worse than peers who never had the tool. The authors put the degradation at 0.054 on a 0 to 1 scale, and describe the result as access to generative AI improving performance while substantially inhibiting learning.
The guardrailed arm, built with teacher input and prompt engineering to give hints instead of answers, did not show the drop. It also did not show a gain on the exam. Removing the harm and producing a benefit are two different achievements, and most vendor decks present the first as the second.
That ordering explains a lot of contradictory coverage. A pilot that measures during-the-lesson work will find large positive effects almost every time. A pilot that measures a week later with the tool switched off will find much less, and sometimes a negative.
Satisfaction moves before learning does
The reviews of pilots that land on a minister’s desk are usually satisfaction surveys, and the corpus has a clean test of whether those track anything.
Kreijkes et al. (2026) ran 344 Year 10 students in England through two text passages under three conditions: traditional note-taking, note-taking with a GPT-3.5 chatbot, or the chatbot alone, all following instructions for active comprehension-focused reading. Note-taking, alone or with the chatbot, beat AI-only use on comprehension and retention. Students preferred the chatbot anyway, and rated it the most helpful of the three, despite it producing the lowest learning performance.
The pattern repeats on the teacher side. Mahinpei et al. (2026) gave 11 teaching assistants in a U.S. machine learning course optional AI-drafted feedback comments: drafts raised the likelihood of giving any feedback by about 11 percentage points and made comments longer, with similar time per character and similar rated usefulness. That is a real improvement in feedback quantity, and it is also the kind of result a survey of TAs would have reported favourably whether or not students learned more.
The review states the general version plainly: AI tools can improve students’ learning experiences even when they do not improve learning outcomes. Satisfaction is a legitimate operational metric. It is not a substitute for a learning measure, and it is the cheapest thing to collect, which is exactly why it dominates the reports.
The educator split is sharper than the student one
The teacher-side findings are where the review adds the most new detail, because the effect depends on how narrow the tool is.
| Study | Sample | What the tool did | Result |
|---|---|---|---|
| Wang et al. (2025), Tutor CoPilot | More than 700 tutors and 1,000 students in U.S. Title I schools | Real-time expert-like suggestions to human tutors during math sessions | Students 4 percentage points more likely to master topics (p<0.01), 9 points for the lowest-rated tutors, about $20 per tutor per year |
| Demszky et al. (2025), TeachFX | 369 U.S. math and science teachers, five months | Automated feedback on questioning technique | Teachers asked 20 percent more focusing questions; no discernible effect on student talk time or reasoning |
| Roy et al. (2024) | 259 science teachers, 68 schools in England, ten weeks | ChatGPT for lesson preparation, with a guide | 25 minutes per week saved, a 31 percent cut, with no drop in quality |
| Kim et al. (2021) | 234 tutors and 2,220 students in South Korea | AI-generated weekly progress reports to home tutors | Student performance improved, but technology overload cancelled the benefit for some tutors |
Tutor CoPilot is the strongest single result in the corpus for a practical reason: it augments a human who is already in the room, and it pays off most for the weakest tutors. That is the shape a deployment should have if the goal is to raise the floor rather than the ceiling.
The new negative result is the closest direct test of the opposite design. Sungu et al. (2026) gave teachers in grades 5 to 12 in Türkiye a GPT-4o teaching-support chatbot for lesson planning, assessment, feedback, differentiation and administration for a full semester, and compared them with teachers continuing usual practice, across 193 teachers and 2,816 students. Average exam scores did not move. Student motivation and confidence fell. Scores declined specifically for students of lower-performing teachers, and the teachers’ own attitudes split by prior use: heavier earlier users became more pessimistic, lighter users more optimistic.
That is a harder finding to explain away than a null. A broad assistant was adopted, used for a semester, produced no average gain, and did damage concentrated in exactly the classrooms where targeted help had previously shown a benefit. The review’s explanation is the output and the expertise needed to evaluate it: a hint about the next question is usable by a novice, while a general plan requires judgement the novice does not yet have.
There is a higher-education data point worth pairing with it. A randomized trial across 2,379 undergraduates and 30 instructors at a large U.S. public university found that giving sections access to a course-integrated AI tutor reduced final grades by 0.37 standard deviations and cut learning-management-system participation by 0.90 standard deviations. Losses were larger for first-generation students. The mechanism the authors propose is displacement: the tool absorbed time that had been going into the course’s existing activities.
Why the corpus doubled and the effect did not
Three end points are being conflated in most of the numbers above, and the review separates them.
In-platform measures. Questions answered, problems completed, mastery flags. These move first and look best.
Interim quizzes. Curriculum-aligned and closer to learning, but short.
Standardized assessments. The slow, expensive one.
A ten-week randomized trial with Eedi in UK secondary schools shows the gap in a single study. It covered 1,179 students across ten schools, with expert tutors reviewing every AI message before it reached a student. AI tutoring performed similarly to human tutoring on in-platform learning and on an intermediate quiz, and both beat standard support. Neither showed a clear advantage over standard support on the Renaissance Star Maths standardized assessment during the trial. The trial also logged the mechanism: students using AI tutoring completed about 14 problems per session against about 19 with static hints. Less coverage, more depth, and no net movement on the test that counts.
That is not a failed intervention. It is a measured trade-off, and the review’s own framing is that tool features and implementation support may matter more than tool type, with interactive formats, adaptive sequencing and tool-use guidance showing promise. The corpus is now specific enough to argue about coverage versus depth instead of arguing about whether AI works.
The geography is worth naming before anyone reuses these numbers. The studies tabulated above were run in the United States, England, Türkiye, Germany, Belgium, Spain, South Korea and Brazil. The nearest sub-Saharan African data point discussed on this blog is a Sierra Leone classroom trial that randomised 48 classrooms across 12 schools, and it is not in this corpus. A ministry deciding on 50,000 seats currently has one or two trials from a neighbouring system plus a strong prior, which is the condition under which a null gets over-read and a vendor number gets repeated.
How many schools does a real effect need
The reason so many of these estimates are small and noisy is arithmetic, not failure. Classroom trials randomize clusters, and clusters cost variance. The standard expression for the variance of the treatment effect, with clusters of equal size, is
\[\mathrm{Var}(\hat{\tau}) = \frac{2\left[\rho + (1-\rho)/m\right]}{J}\]where $\rho$ is the intraclass correlation, $m$ students per cluster and $J$ clusters per arm. The minimum detectable effect at 80 percent power and a two-sided 5 percent alpha is then $(z_{0.975} + z_{0.80})\sqrt{\mathrm{Var}}$.
That is short enough to compute directly. The script below runs the numbers for a plausible school trial, and every figure quoted after it comes from this output.
1
2
3
4
5
6
7
8
9
10
11
12
13
14
15
16
17
18
19
20
21
22
23
24
25
26
27
28
29
30
31
32
33
34
35
36
37
38
39
40
41
42
43
44
45
46
47
48
49
50
51
52
53
54
55
import math

def norm_cdf(z):
    return 0.5 * (1.0 + math.erf(z / math.sqrt(2.0)))

def norm_ppf(p):
    lo, hi = -10.0, 10.0
    for _ in range(300):
        mid = (lo + hi) / 2.0
        if norm_cdf(mid) < p:
            lo = mid
        else:
            hi = mid
    return (lo + hi) / 2.0

ZA = norm_ppf(0.975)   # two-sided alpha 0.05
ZB = norm_ppf(0.80)    # 80 percent power
K = ZA + ZB

def mde(j, m, icc):
    """Minimum detectable effect, SD units, j clusters per arm of size m."""
    se = math.sqrt(2.0 * (icc + (1.0 - icc) / m) / j)
    return K * se

def clusters_needed(target, m, icc):
    """Clusters per arm to detect `target` SD at 80 percent power."""
    se = target / K
    return math.ceil(2.0 * (icc + (1.0 - icc) / m) / se ** 2)

print("z(0.975) = %.4f   z(0.80) = %.4f   sum = %.4f" % (ZA, ZB, K))
print()
print("Minimum detectable effect (SD), 30 students per school, 80% power")
header = "clusters/arm |" + "".join("  ICC %.2f" % i for i in (0.05, 0.10, 0.20, 0.35))
print(header)
for j in (10, 20, 40, 80):
    row = "         %3d |" % j
    row += "".join("    %.3f" % mde(j, 30, i) for i in (0.05, 0.10, 0.20, 0.35))
    print(row)
print()
print("Schools per arm needed to detect a given effect (30 per school)")
for icc in (0.10, 0.20, 0.35):
    for target in (0.10, 0.20, 0.30):
        j = clusters_needed(target, 30, icc)
        print("  ICC %.2f  target %.2f SD -> %4d schools/arm, %6d students/arm"
              % (icc, target, j, j * 30))
print()
for d in (0.10, 0.258, 0.37, 0.50):
    print("effect %.3f SD = median student moves to percentile %.1f"
          % (d, 100 * norm_cdf(d)))
print("mirror for -0.370 SD = percentile %.1f" % (100 * norm_cdf(-0.37)))
print()
j = clusters_needed(0.10, 30, 0.20)
print("Cheapest credible design for 0.10 SD, ICC 0.20, m=30: %d schools total" % (2 * j))
print("students in that design: %d" % (2 * j * 30))
print("cost at USD 4,000 per school for devices and training: USD %s" % format(2 * j * 4000, ","))
1
2
3
4
5
6
7
8
9
10
11
12
13
14
15
16
17
18
19
20
21
22
23
24
25
26
27
28
29
z(0.975) = 1.9600   z(0.80) = 0.8416   sum = 2.8016

Minimum detectable effect (SD), 30 students per school, 80% power
clusters/arm |  ICC 0.05  ICC 0.10  ICC 0.20  ICC 0.35
          10 |    0.358    0.452    0.597    0.764
          20 |    0.253    0.319    0.422    0.540
          40 |    0.179    0.226    0.298    0.382
          80 |    0.127    0.160    0.211    0.270

Schools per arm needed to detect a given effect (30 per school)
  ICC 0.10  target 0.10 SD ->  205 schools/arm,   6150 students/arm
  ICC 0.10  target 0.20 SD ->   52 schools/arm,   1560 students/arm
  ICC 0.10  target 0.30 SD ->   23 schools/arm,    690 students/arm
  ICC 0.20  target 0.10 SD ->  356 schools/arm,  10680 students/arm
  ICC 0.20  target 0.20 SD ->   89 schools/arm,   2670 students/arm
  ICC 0.20  target 0.30 SD ->   40 schools/arm,   1200 students/arm
  ICC 0.35  target 0.10 SD ->  584 schools/arm,  17520 students/arm
  ICC 0.35  target 0.20 SD ->  146 schools/arm,   4380 students/arm
  ICC 0.35  target 0.30 SD ->   65 schools/arm,   1950 students/arm

effect 0.100 SD = median student moves to percentile 54.0
effect 0.258 SD = median student moves to percentile 60.2
effect 0.370 SD = median student moves to percentile 64.4
effect 0.500 SD = median student moves to percentile 69.1
mirror for -0.370 SD = percentile 35.6

Cheapest credible design for 0.10 SD, ICC 0.20, m=30: 712 schools total
students in that design: 21360
cost at USD 4,000 per school for devices and training: USD 2,848,000
Three readings of that table.
Twenty schools per arm, thirty students each, is a typical funded pilot. At an intraclass correlation of 0.20, which is unremarkable for achievement outcomes, it can only resolve effects larger than 0.42 SD. Anything smaller comes back as noise, and a null result from it is uninformative rather than reassuring.
Small effects are expensive to detect. Getting to 0.10 SD at the same correlation takes 356 schools per arm, 712 in total, and 21,360 students. In device and training terms it is a multi-million dollar study, which is why almost nobody runs one in education and why most published estimates are large enough to be visible at pilot scale.
Effect sizes need units. A 0.37 SD loss, the undergraduate tutor result, lands the median student at percentile 64.4 if the effect is positive and 35.6 if it is negative. A 0.10 SD gain lands them at percentile 54.0. Both are real effects; only one is worth the procurement.
The 24-classroom-per-arm design used in the Sierra Leone trial discussed on this blog sits near the 20-cluster row. Its intent-to-treat estimate of 0.258 SD arrived with an interval running from 0.027 to 0.488, which is what a design of that size produces. Reading the point estimate without the interval is how a modest effect becomes a slogan.
What to instrument before you deploy
The review is useful even if you never run a trial, because its findings translate into design rules.
| Rule | What it prevents |
|---|---|
| Measure an unassisted endpoint, not just in-product activity | The 48 percent practice gain and the 17 percent exam loss come from the same students; only one of those numbers is usually reported |
| Pre-register the effect you can detect, not the one you hope for | A 20-school pilot cannot see a 0.10 SD effect, so its null result proves nothing |
| Report the intraclass correlation you assumed | Without it, a sample size cannot be checked by anyone |
| Log session length, messages and problems per session | The 14 versus 19 problems trade-off is invisible unless you instrument it |
| Price per teacher-year, and compare to the coaching it replaces | Tutor CoPilot at about $20 per tutor per year is a price most procurement teams cannot compute, because they buy seats |
| Keep a human who is accountable for the last step | Every favourable educator result cited above has a human deciding what to send |
The last rule covers the widest gap in the evidence. Where a person reviewed the AI’s output before it reached a student, the results were neutral to positive. Where the tool talked directly to students with no constraint, the results split, and the split ran along whether the student was producing work or understanding it.
Key takeaways
| Finding | Number | What it means for a deployment |
|---|---|---|
| The causal corpus more than doubled | 20 to 52 papers in eight months | The field can now argue with evidence, but coverage still misses most classrooms |
| Unrestricted access can displace learning | 48 percent better practice, 17 percent worse unassisted exam | Always measure with the tool switched off |
| Guardrails removed the harm, not the gap | Negative effect essentially eradicated, no positive effect | Assume a well-built tutor buys neutrality until proven otherwise |
| Narrow tools beat broad ones | 4 percentage points overall, 9 for the weakest tutors, at about $20 per tutor-year | Target the human who is already in the room |
| Pilot designs cannot see small effects | 0.42 SD at 20 schools per arm, ICC 0.20 | State the minimum detectable effect before you cite the result |
| Experience is not learning | Positive satisfaction alongside flat or negative outcomes in several studies | Treat survey scores as a leading indicator only |
References
- Walker, S., Fesler, L., Martinez Claeys, JP., Agnew, C., and Loeb, S. (2026). The Evidence Base on AI in K-12: A November 2026 Review. SCALE Initiative, Stanford University. doi.org/10.26300/80wn-ca81 — report page
- Bastani, H., Bastani, O., Sungu, A., Ge, H., Kabakci, O., and Mariman, R. (2025). Generative AI Can Harm Learning. SSRN working paper — SCALE record
- Wharton, Knowledge at Wharton. Without guardrails, generative AI can harm education. knowledge.wharton.upenn.edu
- Wang, R. E., Ribeiro, A. T., Robinson, C. D., Loeb, S., and Demszky, D. (2025). Tutor CoPilot: A Human-AI Approach for Scaling Real-Time Expertise. EdWorkingPaper 24-1056
- Liu, J., Sweet, T., Chen, M. H., Engelberg, J., Masters, M., Clark, M., Persaud, A., Lancaster, A., Hollingsworth, J., and King Rice, J. (2026). The Effects of Course-Integrated AI Tutoring on Student Performance and Engagement: A Randomized University Trial. EdWorkingPaper 26-1598
- EdTech Innovation Hub. Google takes Guided Learning global as schools gain new AI controls. edtechinnovationhub.com
- Kosmyna, N. et al. (2025). Your Brain on ChatGPT. arXiv:2506.08872
- Hayes, R. J., and Moulton, L. H. Cluster Randomised Trials, second edition. Taylor and Francis
- Cochrane Handbook, chapter 23: including variants on randomized trials, design effect and intracluster correlation. cochrane.org
Sample sizes and point estimates for Sungu et al. (2026), Kreijkes et al. (2026), Mahinpei et al. (2026), Ferman et al. (2021), Roy et al. (2024), Demszky et al. (2025), Kim et al. (2021), LearnLM and Eedi (2025), Fischer et al. (2025) and Blasco and Charisi (2025) are quoted from the study tables in the appendix of the review above, where each is classified by design.
Related posts
- 500 Teachers, 15,000 Students, One Shared Tablet — one teacher-facing deployment, read against its own trial design
- Is Your +3-Point Eval Gain Real? — the statistics for deciding whether a measured difference survives
- The $1 Billion AI Bet — how to read the four numbers in an AI funding announcement
- How Many Labels Does Your Language Need? — the same budget logic applied to annotation rather than to schools