How Much Human Support Does AI Advice Need? 605 Weighed Harvests in Kenya and Uganda
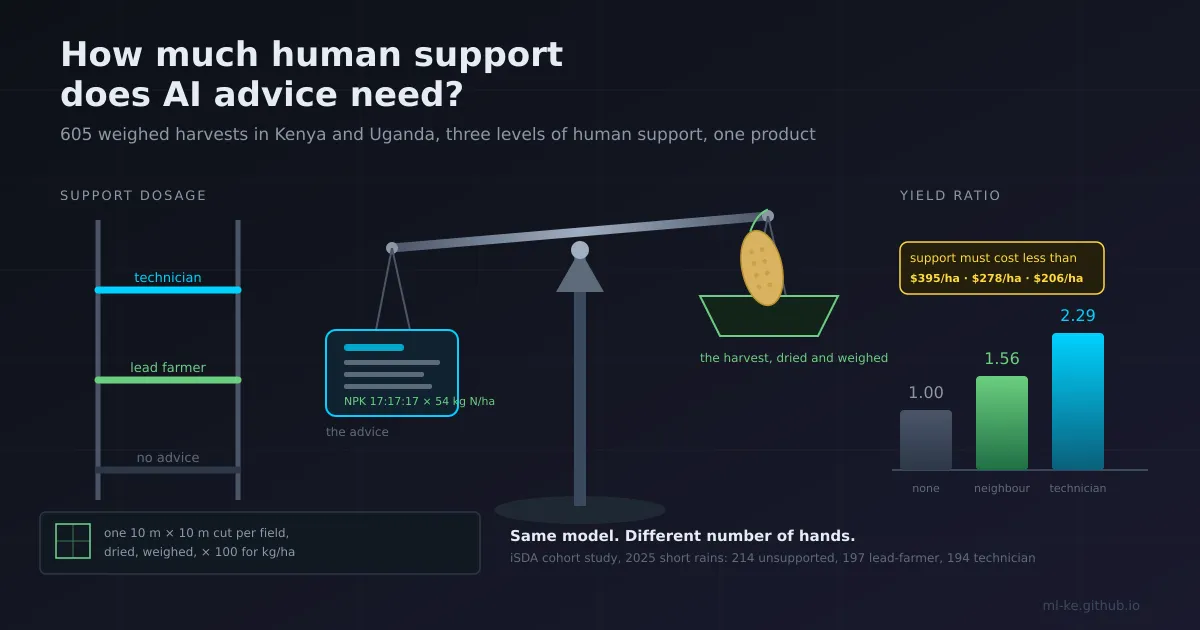
The short version iSDA weighed the harvests of 605 farmers in Kenya and Uganda after a season of AI agronomy advice. Farmers with a trained neighbour behind them harvested 56% more than farmers with no advice. Farmers with an iSDA technician behind them harvested 2.29 times as much. Both groups received the same advice product. What differed was how much human support arrived with it.
The published number for this advisory product used to be a single average. Across eight earlier cohort analyses, farmers using Virtual Agronomist saw a 52% yield increase over traditional practice. That average is true and it is nearly useless for a product team, because it blends at least two very different deliveries into one figure. The October study splits the blend, and the split is the useful part.
What the study varied, and what it held fixed
Virtual Agronomist is a WhatsApp advisory service: a farmer gets plot-specific fertiliser and management recommendations built from soil data and a season-long schedule. During the 2025 short rains, iSDA followed 605 farmers growing maize, sorghum and sunflower in two Kenyan counties (Meru and Tharaka Nithi) and two Ugandan districts (Bulambuli and Sironko), and sorted them into three arms.
| Arm | Farmers | What sat on top of the advice |
|---|---|---|
| No advice | 214 | nothing, and no product |
| Lead-farmer support | 197 | standard support from a trained farmer in the same community |
| Technician support | 194 | intensive support from iSDA consultants working closer to the team |
The design decision worth copying is at the village level. Villages were picked by location and kept apart so one arm’s advice could not leak into another’s, and within those villages farmers were randomly assigned to an arm. That gives you a cheap approximation of a trial while respecting the way advice travels, through people who talk to each other. The unit of randomisation is the farmer. The unit of contamination risk is the village.
What the study did not do: pre-register a hypothesis, report confidence intervals, or publish a p-value. That is ordinary for a programme cohort run by the organisation that also sells the product, and it belongs at the front of any reading of the result. It also sets the size of the arithmetic later in this post.
Weighing the harvest instead of asking about it
The outcome measure is a crop cut. Field staff mark a 10 m by 10 m square near the middle of the plot, harvest every plant inside it, dry the produce, weigh it, and multiply by 100 to reach kilograms per hectare. One cut per field.
The reasons are practical. A farmer’s answer to “how much did you get?” is shaped by bag sizes that differ by trader, by a good season two years back, and by nobody keeping a harvest ledger. A crop cut applies one ruler to every field, which is the property you need when you are comparing arms rather than describing one farm.
A 10 m square is 1% of a hectare, so the scaling factor is exactly 100. The cost of that convenience is sampling error inside the field: one square cannot see the headland, the waterlogged corner, or the strip the goats got into. The study hedges this two ways, by asking farmers what they harvested as a second, weaker measure, and by reporting that the self-reports told a similar story. Results were then adjusted for crop, country and soil nutrient levels so that a fertile plot in Meru was not compared directly with a tired one in Sironko.
The ladder: 1.56, then 2.29
Farmers with a lead farmer’s support harvested 56% more than farmers who used no advice, a yield ratio of 1.56. That direction held in all four crop-and-country combinations, maize and sorghum in Kenya, maize and sunflower in Uganda.
Farmers supported by iSDA technicians went further: 2.29 times the harvest of the no-advice arm. Divide the two and the technician arm produced about 1.5 times what the lead-farmer arm produced on the same advice.
| Arm | Yield ratio vs no advice |
|---|---|
| No advice | 1.00 |
| Lead-farmer support | 1.56 |
| Technician support | 2.29 |
Read that as a dosage curve rather than as two products. The advice is constant across the supported arms. The variable is how much of the season a second person was present for, and the second tier of support adds more to the ratio than the first one did. If you had shipped only the model and reported a blended average, you would have seen the product work and never learned that the same model returned 1.56 where a technician returned 2.29.
A dry season makes the gain harder to explain away
Weather is the first alternative explanation for any yield result, and the 2025 short rains were bad in both countries.
The Kenya Meteorological Department’s December 2025 outlook reports that the peak short-rains month was unusually dry across much of the country, and that the Meru station recorded 28.7% of its long-term mean rainfall for November. In Uganda the rains started late and came in below average across most of the country, then produced flooding in the east in early November.
Two things follow. All three arms farmed through the same failure, so this is not a good year flattering the supported arms. And a ratio measured in a drought is not a forecast: if the supported arm held its harvest while the unsupported one collapsed, the ratio inflates, and if extra fertiliser stranded without water, it deflates. Treat the direction as the finding and the magnitude as specific to that season.
Fertiliser accounts for part of it
The supported arms bought more nitrogen, which is the mechanism you would want to see.
| Arm | Nitrogen applied |
|---|---|
| No advice | 28 kg/ha |
| Lead-farmer support | 47 kg/ha |
| Technician support | 54 kg/ha |
That is about 19 kg more nitrogen per hectare with a lead farmer and 26 kg more with a technician. The advice changed what farmers bought, and the purchase is a visible, countable intermediate outcome, which is more than most AI products can offer as evidence that anything happened.
But iSDA’s own early analysis says nitrogen alone did not explain the technician gains. The authors point instead at management across the season: weeding, crop protection, and recommendations applied accurately and on time.
That sentence is where the whole post turns. Advice becomes yield through a sequence of field operations, and every operation has a deadline attached to a labour market. A farmer working alone has to notice the deadline, decide to spend, find the input in stock nearby, and hire hands in the right week. Somebody who has already run the same season shortens each of those steps, and none of that work shows up in a recommendation engine’s logs.
What the margins put a ceiling on
Yield is the agronomic outcome. Money is the one that decides whether a farmer does it again next season.
The study reports gross margin per hectare, computed from crop-cut yields and fertiliser cost. Uganda sunflower went from about $233 per hectare with no advice to $439 with a lead farmer’s support and $628 with a technician. Kenya maize went from $158 to $436 with technician support. In Kenya sorghum and Uganda maize the margins were higher on average but the gap was small enough that it could have been chance, and Kenya’s margins sit lower overall because those farmers spent more on fertiliser and harvested less.
Gross margin leaves out labour, land and the cost of delivering the advice, so it is not profit. That exclusion is also an opportunity, because the margin gain is exactly the largest amount the support tier is allowed to cost before it stops paying for itself.
1
2
3
4
5
6
7
8
9
10
11
12
13
14
15
16
17
18
19
20
21
22
23
24
25
26
27
28
29
30
31
32
33
34
35
36
37
38
39
40
41
42
43
44
45
46
47
# Published figures from iSDA's 2025 short-rains cohort study (n = 605).
# Every number below is arithmetic on the study's own reported values.
groups = {
    "no advice":       {"n": 214, "yield_ratio": 1.00, "nitrogen_kg_ha": 28},
    "lead farmer":     {"n": 197, "yield_ratio": 1.56, "nitrogen_kg_ha": 47},
    "isda technician": {"n": 194, "yield_ratio": 2.29, "nitrogen_kg_ha": 54},
}

print("farmers in the study:", sum(g["n"] for g in groups.values()))
print("technician tier vs lead-farmer tier, yield:",
      round(groups["isda technician"]["yield_ratio"] / groups["lead farmer"]["yield_ratio"], 2))
print("extra nitrogen per hectare, lead farmer:",
      groups["lead farmer"]["nitrogen_kg_ha"] - groups["no advice"]["nitrogen_kg_ha"], "kg")
print("extra nitrogen per hectare, technician:",
      groups["isda technician"]["nitrogen_kg_ha"] - groups["no advice"]["nitrogen_kg_ha"], "kg")

# Gross margin per hectare, after fertiliser cost, from the study's own table.
margin = {
    ("uganda", "sunflower"): {"no advice": 233, "lead farmer": 439, "isda technician": 628},
    ("kenya", "maize"):      {"no advice": 158, "isda technician": 436},
}

for (country, crop), m in margin.items():
    base = m["no advice"]
    print(f"\n{country} {crop}: no advice ${base}/ha")
    for tier in ("lead farmer", "isda technician"):
        if tier in m:
            gain = m[tier] - base
            print(f"  {tier:15s} ${m[tier]}/ha  gain ${gain}/ha"
                  f"  ceiling on support cost ${gain}/ha")

# What the extra nitrogen bought, as an accounting ratio (not a causal claim).
per_kg = {}
for tier in ("lead farmer", "isda technician"):
    extra_n = groups[tier]["nitrogen_kg_ha"] - groups["no advice"]["nitrogen_kg_ha"]
    per_kg[tier] = (margin[("uganda", "sunflower")][tier] - 233) / extra_n
print("\ngross-margin gain per extra kg of nitrogen, uganda sunflower:")
for tier, v in per_kg.items():
    print(f"  {tier:15s} ${v:.2f}/kg")
print("technician minus lead farmer, per extra kg of nitrogen:"
      f" ${per_kg['isda technician'] - per_kg['lead farmer']:.2f}/kg")

# Staffing multipliers implied by the two national extension ratios.
ratios = {"kenya": (1380, 600), "uganda": (1800, 500)}
print("\nstaffing multiplier to reach the proposed ratio:")
for country, (actual, target) in ratios.items():
    print(f"  {country:7s} {actual}:1 today, {target}:1 target, {actual / target:.1f}x")
1
2
3
4
5
6
7
8
9
10
11
12
13
14
15
16
17
18
19
20
farmers in the study: 605
technician tier vs lead-farmer tier, yield: 1.47
extra nitrogen per hectare, lead farmer: 19 kg
extra nitrogen per hectare, technician: 26 kg

uganda sunflower: no advice $233/ha
  lead farmer     $439/ha  gain $206/ha  ceiling on support cost $206/ha
  isda technician $628/ha  gain $395/ha  ceiling on support cost $395/ha

kenya maize: no advice $158/ha
  isda technician $436/ha  gain $278/ha  ceiling on support cost $278/ha

gross-margin gain per extra kg of nitrogen, uganda sunflower:
  lead farmer     $10.84/kg
  isda technician $15.19/kg
technician minus lead farmer, per extra kg of nitrogen: $4.35/kg

staffing multiplier to reach the proposed ratio:
  kenya   1380:1 today, 600:1 target, 2.3x
  uganda  1800:1 today, 500:1 target, 3.6x
Read the ceilings as budgets. On Ugandan sunflower a technician visit can cost up to $395 per hectare in a season and the farmer still ends the season ahead of where the no-advice arm ended. On Kenyan maize the ceiling is $278 per hectare. Above that, the tier is spending more than it returns, and the lead-farmer tier is the one to protect because its ceiling is lower but so is its cost.
The nitrogen line needs a warning attached. Gross-margin gain per extra kilogram of nitrogen is an accounting ratio, not a causal one. It divides the whole margin gain by one input, which assumes the extra fertiliser is what produced the gain, and the study explicitly doubts that. The comparison is still informative: the technician arm earned $4.35 more per kilogram of extra nitrogen than the lead-farmer arm did, and almost nothing separates those two arms except the support. That is the fingerprint of management rather than inputs.
Reach is the constraint the agronomy ignores
A support tier is a staffing model for as long as its support is paid labour. Two published ratios set the scale.
Kenya’s Ministry of Agriculture and Livestock Development reports an extension agent to farmer ratio of 1:1,380 against a proposed 1:600 in its 2025 extension manual, a 2.3 times staffing gap. Uganda’s figures put the ratio at one officer per 1,800 farmers against a recommended one per 500, which is 3.6 times the officers the recommendation implies.
That arithmetic rules out one of the three tiers at national scale. A paid technician who works closely with a handful of farms cannot be the delivery model for a system serving thousands of farmers per officer, however well the tier performs. The lead-farmer tier is the only one in the study that scales, because its support is a neighbour rather than an employee, and it already carries most of the reach: 197 of 605 farmers in this cohort sat in it.
The study’s own reading points the same way. It notes that the quality of support matters, since farmers helped by people who know the product best harvested the most, and it commits to continuing investment in lead-farmer training. The design implication is uncomfortable for anyone hoping to ship a model and leave: the tier that scales needs ongoing human training, and the tier that needs none does not scale.
Could those margin gaps have been chance?
The study says outright that the Kenya sorghum and Uganda maize margin gaps could have been chance. That claim is checkable, and the check tells you what to instrument next season.
1
2
3
4
5
6
7
8
9
10
11
12
13
14
15
16
17
18
19
20
21
22
23
24
25
26
27
28
29
30
31
32
33
34
35
36
37
38
39
40
41
# Can the study resolve the gaps it reports? Standard two-arm power arithmetic
# on the log scale, with a design effect for village-level clustering.
# CV values are labelled assumptions; the study reports neither them nor the ICC.
import math

Z_ALPHA, Z_POWER = 1.959964, 0.841621  # two-sided 5%, 80% power


def design_effect(cluster_size=10, icc=0.05):
    return 1 + (cluster_size - 1) * icc


def mde_ratio(n_per_arm, cv, de):
    """Smallest yield ratio this design can detect at 80% power."""
    se = math.sqrt(2) * cv / math.sqrt(n_per_arm) * math.sqrt(de)
    return math.exp((Z_ALPHA + Z_POWER) * se)


def n_per_arm(ratio, cv, de):
    """Farmers per arm needed to detect `ratio` at 80% power."""
    effect = math.log(ratio)
    return math.ceil(2 * ((Z_ALPHA + Z_POWER) * cv) ** 2 * de / effect ** 2)


de = design_effect()
print(f"design effect with 10 farmers per village and ICC 0.05: {de:.2f}")
print("\nsmallest yield ratio detectable, per arm:")
for n in (100, 200, 400):
    print(f"  n = {n:3d}, CV 0.45: {mde_ratio(n, 0.45, de):.3f}")
print("\nfarmers per arm needed to detect a given yield ratio, CV 0.45:")
for r in (1.15, 1.30, 1.56, 2.29):
    print(f"  ratio {r:.2f}: {n_per_arm(r, 0.45, de)} per arm")

print("\nsame design, but for gross margin per hectare (CV 0.90):")
for n in (197, 200):
    print(f"  n = {n:3d}: smallest detectable margin ratio {mde_ratio(n, 0.90, de):.3f}")

# Does ~200 per arm separate the two headline ratios from 1.00?
headline = mde_ratio(194, 0.45, de)
print(f"\nheadline check: 194 per arm resolves {headline:.3f},"
      f" the reported gains are 1.56 and 2.29 -> {1.56 > headline} and {2.29 > headline}")
1
2
3
4
5
6
7
8
9
10
11
12
13
14
15
16
17
18
design effect with 10 farmers per village and ICC 0.05: 1.45

smallest yield ratio detectable, per arm:
  n = 100, CV 0.45: 1.239
  n = 200, CV 0.45: 1.164
  n = 400, CV 0.45: 1.113

farmers per arm needed to detect a given yield ratio, CV 0.45:
  ratio 1.15: 236 per arm
  ratio 1.30: 67 per arm
  ratio 1.56: 24 per arm
  ratio 2.29: 7 per arm

same design, but for gross margin per hectare (CV 0.90):
  n = 197: smallest detectable margin ratio 1.358
  n = 200: smallest detectable margin ratio 1.355

headline check: 194 per arm resolves 1.167, the reported gains are 1.56 and 2.29 -> True and True
The yield comparison is comfortable. With roughly 200 farmers per arm, a coefficient of variation of 0.45 and a modest clustering penalty, the smallest ratio this design can distinguish from no effect is about 1.17. The reported 1.56 and 2.29 sit well outside that, and the design would need only 24 farmers per arm to see the smaller of the two. The headline result is not a power problem.
The margin comparison is the opposite. Gross margin per hectare varies far more than yield does, because it multiplies a variable harvest by an input cost that itself moves with the season. At the same arm sizes, the smallest detectable margin ratio is around 1.36, so any margin gap under roughly 36% sits inside the noise. That is consistent with the study calling its own sorghum and maize margin gaps possibly chance, and it explains why the sunflower margin, which moves from $233 to $628, is the one the authors quote.
The design lesson for the next cohort is specific. If margins are the decision variable, arm sizes around 200 farmers cannot resolve a 20% margin difference. Getting there needs a lower-variance margin measure, such as repeated plots per farmer or two seasons pooled, rather than simply more farmers.
The human layer is a role, not a checkbox
The other half of the question is what the person in the middle does, and a separate 2026 study on extension agents in Benin gives a useful read on that.
Researchers surveyed 240 extension agents across six districts in northern Benin and modelled how they take up generative AI, using the Technology Acceptance Model. Their headline findings are that GenAI use is positively associated with advisory performance, meaning speed, precision and relevance of the advice, and that workload and time pressure are the main drivers of use. Agents reach for the tool when they are overloaded, which is the honest description of most extension systems.
The finding that matters here is a reversal. Attitude had a negative association with behavioural intention. Agents who rated the tool more highly were not more willing to depend on it. The authors read that as accountability pressure: a wrong recommendation costs the agent credibility with farmers, and the agent knows it. They also note that ChatGPT-style tools are weak on the site-specific parts of agronomy, the planting date, the seed rate, the fertiliser split, which is exactly the segment iSDA’s soil-data product targets.
The study is cross-sectional, covers one region, and measures both use and performance with single items, so treat it as a description of a tension rather than a causal claim. The tension is the durable part. A model plus a farmer is a two-party system with nobody accountable for a wrong recommendation and nobody positioned to catch one. Both tiers that worked in the Kenya and Uganda cohort inserted a third party whose reputation was on the line. That is a product decision as much as an agronomy one.
Instrumenting the support ladder
If support dosage is the treatment, then it has to be logged like one. A team building an advisory product can start with the variables that the cohort study shows matter, none of which require a smartphone sensor.
| What to log | Per what | Why it is on the list |
|---|---|---|
| Advice opened, and which recommendation | farmer, per week | separates “received” from “read” |
| Input purchased, and quantity | farmer, per season | the nitrogen gap was 19 to 26 kg/ha |
| Date of application against recommended date | recommendation | the study’s own timing hypothesis |
| Weeding and crop-protection events | farmer, per season | the management channel it points at |
| Support contacts, and who made them | farmer, per season | the dosage variable itself |
| Crop cut, weight dry | plot, per season | the outcome that survives scrutiny |
Two design rules follow from the study. First, run the dosage as the arm: same model, different support, assigned at village level. Teams that A/B only model versions measure the smallest effect in the system and then argue about whether a two-point difference is real. Second, measure the supporter as well as the farmer. In the cohort, farmers helped by people who knew the product best harvested the most, which makes lead-farmer training a treatment arm rather than an operations overhead.
For teams building advice products elsewhere
The structure generalises past agriculture, because the mechanism does not care about the crop.
Any advisory product that changes behaviour through a sequence of timed actions inherits the same shape: a recommendation, a purchase or preparation step, an execution window, and an outcome that shows up weeks later. Extension in health, in finance, in classroom practice all have that shape. In each case the model can shorten the first step and cannot perform the rest.
The measurable version of the question is the ceiling. Take the outcome difference between the supported and unsupported groups, price it in the unit the user cares about, and you have the maximum the support layer may cost per user before it stops paying. On Ugandan sunflower that ceiling was $395 per hectare for a technician and $206 for a lead farmer. The ratio between them tells you how much worse the cheaper tier is allowed to be, and the extension ratios tell you which one you can afford to staff.
Key takeaways
| Point | Number | What to do with it |
|---|---|---|
| Advice alone is not the product | 1.56 with a trained neighbour, 2.29 with a technician | report support dosage next to every effect size |
| The published average hides the split | 52% across eight earlier cohorts | stop quoting a blended mean, publish by tier |
| Support is not free, so price it | ceilings of $206, $278 and $395 per hectare | check the visit cost against the ceiling before scaling a tier |
| Only one tier scales | extension ratios of 1:1,380 and 1:1,800 | put the reach into the design, not the pilot |
| The yield result is solid, the margin result is not | detectable ratio 1.17 for yield, 1.36 for margin | size the next cohort by the variable you will decide on |
| The person in the middle needs standing | 240 agents, positive performance, negative intent | give the supporter a reason to check the advice |
References
- iSDA, “How Much Human Support Does AI Advice Need?” (21 October 2026) — isda-africa.com
- iSDA, “The Data Beneath the Harvest” (17 August 2026) — isda-africa.com
- Kenya Meteorological Department, December 2025 monthly weather forecast (Meru at 28.7% of long-term mean) — meteo.go.ke
- Ministry of Agriculture and Livestock Development, Agriculture Extension Manual (2025), ratio 1:1,380 against a proposed 1:600 — fsrp.go.ke
- New Vision, “Extension services better, boost Ugandan farmers”, ratio 1:1,800 against a recommended 1:500 — newvision.co.ug
- Frontiers in Artificial Intelligence, “Generative AI use and advisory performance among agricultural extension agents in Benin” (2026), 240 agents, six districts — frontiersin.org
- iSDA, Virtual Agronomist product description, WhatsApp delivery across eight countries — isda-africa.com
Related posts
- Four Times the Fields: The Delivery Stack Behind the Google–Gates Farmer AI Plan — the reach and distribution side of farm AI
- Is +3 Points Real? One Population, Twenty 200-Item Eval Sets — the same power arithmetic applied to model evaluations
- 44,000 Seeds, One Open Map: What the Dryland Sorghum Pangenome Changes for Breeders — the upstream genetics this advice sits on top of
- Annotator Agreement Before You Train — measuring the humans in a labelling loop