pass@k Is Not Reliability: Sizing an Eval So the pass^k You Publish Survives
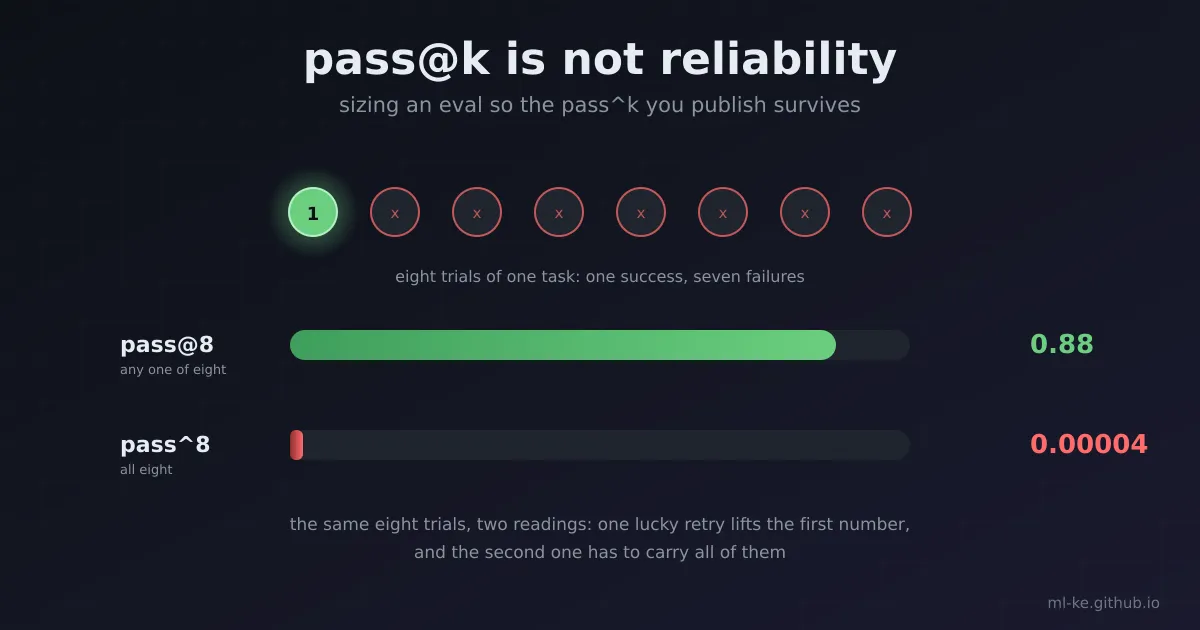
The short version pass@k asks whether any one of k attempts succeeded. pass^k asks whether all k did. The first climbs toward 1 as you add attempts, so it prices compute rather than capability. The second falls, and it is the number you can promise a user. On a simulated 100-task set, two populations post the identical pass@8 of 0.879 and differ by a factor of 11,483 on pass^8. A confidence interval built over all trials as if they were independent is 8.8 times too narrow at 256 trials per task.
The paired eval post compared two systems on one set of items, one score per item per system. This post is the other axis: one system, scored k times per task, and how many attempts you may count before the number stops moving.
Agent evaluation borrowed a code-generation metric and pointed it at tasks where the retry is the product. Kapoor and colleagues put the objection in one sentence in AI Agents That Matter: “Accuracy alone cannot identify progress because it can be improved by scientifically meaningless methods such as retrying.”
Two numbers, one caret
Yao, Shinn, Razavi and Narasimhan introduced pass^k in the τ-bench paper, submitted to arXiv on 17 June 2024. Their abstract gives the definition and the finding together: they propose “a new metric (pass^k) to evaluate the reliability of agent behavior over multiple trials”, and report that state-of-the-art function-calling agents “succeed on <50% of the tasks, and are quite inconsistent (pass^8 <25% in retail)”.
The formal difference is one minus sign. For n trials with c successes, their unbiased estimators are pass@k = 1 - E[C(n-c, k) / C(n, k)] and pass^k = E[C(c, k) / C(n, k)]. The first is a failure probability by any route: one minus the chance that all k draws came from the n-c failed trials. The second is the chance that no draw failed. Both are means over tasks.
They move in opposite directions. 1 - (1-p)^k rises with k and passes 0.999 long before the capability is reliable; p^k falls with k, fastest where p is middling. τ-bench shows the crossing: gpt-4o’s function-calling agent has “> 60% average task success” and its pass^8 drops below 25%. Their main results table runs “at least 3 trials per task” while the reliability curve plots k out to 32, so pass^8 is not computable from the accuracy run at all.
The estimator, and where the naive form goes blind
Chen and colleagues published the estimator in the Codex paper in July 2021, as equation 1 and as a short script labelled “numerically stable” that counts failed samples and multiplies out the survival probability. Most repositories copied it. Three things go wrong, and they are not the same failure.
1
2
3
4
5
6
7
8
9
10
11
12
13
14
15
16
17
18
19
20
21
22
23
24
25
26
27
28
29
30
31
32
33
34
35
36
37
38
39
40
41
42
43
44
45
46
47
48
49
50
51
52
53
54
55
56
57
58
59
import numpy as np
from fractions import Fraction
from math import comb, lgamma


def exact(n, c, k):
    if n - c < k:
        return 1.0
    return float(1 - Fraction(comb(n - c, k), comb(n, k)))


def product_form(n, c, k):        # Chen et al. 2021, Figure 3, as published
    if n - c < k:
        return 1.0
    return float(1.0 - np.prod(1.0 - k / np.arange(n - c + 1, n + 1)))


def log_form(n, c, k):            # 1 - exp(log ratio), plus the log term
    if n - c < k:
        return 1.0, float("-inf")
    lf = (lgamma(n - c + 1) - lgamma(n - c - k + 1)
          - lgamma(n + 1) + lgamma(n - k + 1))
    return float(-np.expm1(lf)), lf


def plug_in(n, c, k):             # what a dashboard does with pass@1 p_hat
    p = c / n
    return 1 - (1 - p) ** k


print("a. agreement with exact rational arithmetic, where the value fits")
worst = 0.0
for n in (40, 80, 200, 600):
    for c in range(1, n, max(1, n // 11)):
        for k in (1, 2, 4, 8, 16, 32):
            e = exact(n, c, k)
            if 0.0 < e < 1.0:
                worst = max(worst, abs(product_form(n, c, k) - e) / e)
print(f"   worst relative error of the product form: {worst:.1e}")

print("\nb. the product form runs out of range before the answer does")
for n, c, k in ((2000, 1000, 999), (3000, 1500, 1499), (4000, 2000, 1999)):
    v, lf = log_form(n, c, k)
    print(f"   n={n} c={c} k={k}: product form {product_form(n, c, k):.1f}, "
          f"log form {v:.1f}, log(1 - pass@k) {lf:8.1f}")

print("\nc. float(comb(...)) once the coefficients get large")
for n in (600, 1000, 1100):
    try:
        r = float(comb(n, n // 2)) / float(comb(n - 1, n // 2))
        print(f"   n={n}: ratio {r:.6f}")
    except OverflowError:
        print(f"   n={n}: OverflowError")

print("\nd. the plug-in form, which raises the observed pass@1 to the k")
print(f"{'n':>6s}{'c':>6s}{'k':>4s}{'exact':>10s}{'plug-in':>10s}{'gap':>10s}")
for n, c, k in ((200, 20, 8), (200, 50, 8), (200, 100, 8), (1000, 400, 16)):
    e = exact(n, c, k)
    print(f"{n:6d}{c:6d}{k:4d}{e:10.6f}{plug_in(n, c, k):10.6f}{e - plug_in(n, c, k):+10.6f}")
1
2
3
4
5
6
7
8
9
10
11
12
13
14
15
16
17
18
19
a. agreement with exact rational arithmetic, where the value fits
   worst relative error of the product form: 2.3e-14

b. the product form runs out of range before the answer does
   n=2000 c=1000 k=999: product form 1.0, log form 1.0, log(1 - pass@k)  -1375.4
   n=3000 c=1500 k=1499: product form 1.0, log form 1.0, log(1 - pass@k)  -2067.9
   n=4000 c=2000 k=1999: product form 1.0, log form 1.0, log(1 - pass@k)  -2760.6

c. float(comb(...)) once the coefficients get large
   n=600: ratio 2.000000
   n=1000: ratio 2.000000
   n=1100: OverflowError

d. the plug-in form, which raises the observed pass@1 to the k
     n     c   k     exact   plug-in       gap
   200    20   8  0.576356  0.569533 +0.006824
   200    50   8  0.904586  0.899887 +0.004699
   200   100   8  0.996623  0.996094 +0.000529
  1000   400  16  0.999740  0.999718 +0.000022
Block a is the reassuring one. The product form is accurate to 2.3e-14 relative error against exact rational arithmetic wherever it returns neither 0 nor 1. It is not a precision bug.
Block b is a range bug. Once C(n-c,k)/C(n,k) falls below the smallest positive double the product collapses to 0.0 and pass@k returns exactly 1.0. The true failure probability is e to the minus 1375 in the two-thousand-sample case, e to the minus 2068 at three thousand, e to the minus 2761 at four thousand, and the product form returns the identical float for all three. The log form keeps the failure term in nats, so two thousand nats of ordering survive there and nowhere else.
Block c stops a script rather than corrupting one. float(comb(...)) overflows a double at n=1100, so a per-task coefficient ratio at that sample size dies with OverflowError instead of returning a wrong number. Fraction and lgamma survive because neither materialises the coefficient.
Block d changes a published figure. The plug-in form takes observed pass@1, calls it p, and computes 1-(1-p)^k. It is wrong in one direction, always low, and the error tracks how far p sits from the extremes: 0.576356 against 0.569533 at 20 successes in 200 trials with k=8, a gap of 0.68 points; 0.47 points at 50 in 200; 0.05 at 100. Chen and colleagues flagged it themselves, writing that the plug-in “results in a consistent underestimate” and that “the gap doesn’t fully close even when n > 5k”. A half-point bias in an eval whose threshold is a one-point difference is the whole signal.
Why pass@k flatters a lucky retry
Kapoor, Stroebl, Siegel, Nadgir and Narayanan argued the functional does not transfer to agents, and their case in AI Agents That Matter starts with cost accounting. The metric was built for a setting where a retry is cheap and the verifier is exact, where the question is how much sampling buys a working program. Their abstract names the failure: “there is a narrow focus on accuracy without attention to other metrics. As a result, SOTA agents are needlessly complex and costly.” Section 2 notes that “when the agent environment has easy signals to check if an answer is correct, repeatedly retrying can lead to even more compelling performance gains”, and cites Li and colleagues’ measurement that AlphaCode’s accuracy rises from close to 0% zero-shot to over 15% with 1,000 retries and over 30% with a million.
A number that rises when you spend more inference is a price, not a property. The labelling rule follows from that. If your headline is pass@k, the k is a compute setting and travels with the cost. If your headline is pass^k, the k is a promise about repeated use and travels with the task count and its interval.
A hundred tasks where the aggregate lies
Two populations of 100 tasks. The first draws each task’s success probability from a band around a quarter, a tenth wide either side, so every task is a coin flip that lands heads about a quarter of the time. The second matches the first on pass@8 exactly, putting half the tasks at 0.99 and solving for what the other half needs.
1
2
3
4
5
6
7
8
9
10
11
12
13
14
15
16
17
18
19
20
21
22
23
24
25
26
27
28
29
30
31
32
33
34
35
36
37
38
39
40
41
42
43
44
45
import numpy as np
from fractions import Fraction
from math import comb

TASKS, TRIALS, K = 100, 2048, 8


def pass_at_k(n, c, k):
    if n - c < k:
        return 1.0
    return float(1 - Fraction(comb(n - c, k), comb(n, k)))


def pass_hat_k(n, c, k):
    if c < k:
        return 0.0
    return float(Fraction(comb(c, k), comb(n, k)))


rng = np.random.default_rng(7)
p_tight = 0.25 + 0.10 * (2 * rng.random(TASKS) - 1)
target = np.mean(1 - (1 - p_tight) ** K)

half, p_hi = TASKS // 2, 0.99
p_lo = 1 - (1 - (target - (half / TASKS) * (1 - (1 - p_hi) ** K)) / (1 - half / TASKS)) ** (1 / K)
p_mix = np.full(TASKS, p_lo)
p_mix[rng.permutation(TASKS)[:half]] = p_hi

print(f"target pass@{K} from the tight population: {target:.4f}")
print(f"matched population: {half} of {TASKS} tasks at p={p_hi}, the rest at p={p_lo:.4f}")

print(f"\n{'population':11s}{'basis':13s}{'pass@1':>8s}{'pass@8':>8s}{'pass^8':>11s}")
out = {}
for label, p in (("tight", p_tight), ("matched", p_mix)):
    ex = (np.mean(p), np.mean(1 - (1 - p) ** K), np.mean(p ** K))
    c = rng.binomial(TRIALS, p)
    sm = (np.mean(c / TRIALS),
          np.mean([pass_at_k(TRIALS, int(ci), K) for ci in c]),
          np.mean([pass_hat_k(TRIALS, int(ci), K) for ci in c]))
    out[label] = sm
    print(f"{label:11s}{'exact':13s}{ex[0]:8.3f}{ex[1]:8.3f}{ex[2]:11.2e}")
    print(f"{'':11s}{f'{TRIALS} trials':13s}{sm[0]:8.3f}{sm[1]:8.3f}{sm[2]:11.2e}")

print(f"\npass@8 gap {abs(out['tight'][1] - out['matched'][1]):.3f} points, "
      f"pass^8 ratio {out['matched'][2] / out['tight'][2]:,.0f}x")
1
2
3
4
5
6
7
8
9
10
target pass@8 from the tight population: 0.8790
matched population: 50 of 100 tasks at p=0.99, the rest at p=0.1625

population basis          pass@1  pass@8     pass^8
tight      exact           0.247   0.879   4.12e-05
           2048 trials     0.246   0.878   4.02e-05
matched    exact           0.576   0.879   4.61e-01
           2048 trials     0.576   0.879   4.61e-01

pass@8 gap 0.001 points, pass^8 ratio 11,483x
The two populations agree on pass@8 to a thousandth of a point, 0.878 against 0.879 sampled and 0.879 against 0.879 exact, because the matching was analytical and the noise at 2,048 trials is small. The exact column also lets you check the estimator rather than trust it: mean(p) 0.247 against a sampled 0.246, mean(p^8) 4.12e-05 against a combinatorial 4.02e-05.
They disagree by 33 points on pass@1, 0.246 against 0.576. pass@8 saturates: eight attempts land at least one success on 87.9% of the tight population’s tasks, and on 87.9% of the matched population’s tasks. One success out of eight is a low bar and both systems clear it.
They disagree by 11,483× on pass^8, 4.02e-05 against 4.61e-01. The tight population cannot get eight consecutive successes on any task because no task is that reliable. The matched population gets eight of eight on its solid half every time, which is 0.5 × 0.99^8, and its other half contributes nothing.
The verdict is blunt. A pass@8 of 0.88 is consistent with a system dependable on half your traffic and hopeless on the rest, and with a system that is uniformly a coin flip. Those need different responses and the aggregate cannot separate them.
The unit of resampling is the task
There are two formulas for the standard error on an eval score, and only one is correct here. The wrong one treats TASKS × K trials as independent Bernoulli draws and computes sqrt(m(1-m)/(TASKS × K)). That is what a per-request dashboard does, and it is the error Miller names in Adding Error Bars to Evals: “computing a pooled standard error across all KN answers will be inconsistent, as multiple answers to the same question would violate the assumption of independent draws.”
The right one resamples tasks, because each task carries its own difficulty and trial-to-trial variation inside a task is not the variation that moves the mean. The block draws 100 tasks with success probability uniform on [0.05, 0.95] and compares the two intervals as the trial count climbs.
1
2
3
4
5
6
7
8
9
10
11
12
13
14
15
16
17
18
19
20
21
22
23
24
25
26
import numpy as np

TASKS, REPS = 100, 4000
p = np.random.default_rng(11).uniform(0.05, 0.95, TASKS)
var_between = p.var(ddof=1)
var_within = np.mean(p * (1 - p))

print(f"{TASKS} tasks, per-task success drawn uniform on [0.05, 0.95]")
print(f"variance between tasks {var_between:.4f}, expected within-task {var_within:.4f}\n")
print(f"{'trials/task':>12s}{'mean':>8s}{'naive SE':>10s}{'cluster SE':>12s}{'ratio':>8s}")

rng = np.random.default_rng(3)
for K in (1, 2, 4, 16, 64, 256):
    rate = rng.binomial(K, p) / K
    m = rate.mean()
    naive = np.sqrt(m * (1 - m) / (TASKS * K))
    idx = rng.integers(0, TASKS, (REPS, TASKS))
    boot = rate[idx].mean(1)
    cluster = boot.std(ddof=1)
    print(f"{K:12d}{m:8.3f}{naive*100:9.2f}p{cluster*100:11.2f}p{cluster/naive:8.1f}")

floor = np.sqrt(var_between / TASKS)
print(f"\nfloor as trials go to infinity: {floor*100:.2f} points "
      f"(95% half-width {1.96*floor*100:.2f} points)")
print(f"trials for the within-task term to fall below 5% of the between-task term: "
      f"{var_within / (0.05 * var_between):.0f}")
1
2
3
4
5
6
7
8
9
10
11
12
13
100 tasks, per-task success drawn uniform on [0.05, 0.95]
variance between tasks 0.0739, expected within-task 0.1751

 trials/task    mean  naive SE  cluster SE   ratio
           1   0.420     4.94p       4.97p     1.0
           2   0.455     3.52p       3.86p     1.1
           4   0.480     2.50p       3.42p     1.4
          16   0.461     1.25p       2.76p     2.2
          64   0.459     0.62p       2.77p     4.4
         256   0.456     0.31p       2.75p     8.8

floor as trials go to infinity: 2.72 points (95% half-width 5.33 points)
trials for the within-task term to fall below 5% of the between-task term: 47
At one trial per task the two standard errors agree, 4.94 points against 4.97, because there is no clustering left to ignore. By 16 trials the naive interval reads 1.25 points and the clustered one 2.76, a factor of 2.2; by 256 trials, 0.31 against 2.75, a factor of 8.8. The clustered column has already hit the floor of sqrt(var_between/TASKS), 2.72 points. The naive column keeps shrinking, which is what makes it dangerous: adding trials appears to buy precision and past a point buys confidence instead.
The mean column wobbles between 0.420 and 0.480 because each row is a fresh 100-task draw, which is the design variance itself. An interval claiming a 0.31-point half-width at 256 trials claims precision the task sample cannot support.
Miller’s Table 4 shows the same thing on real evals, reporting DROP as 9,622 questions drawn from 588 clusters with a clustered standard error of 1.34 against a naive 0.44, a ratio of 3.05, and concluding that “clustered standard errors can be over 3X larger than naive standard errors”. Abadie and colleagues ask when the correction applies; for an eval set the task is the cluster.
Two things follow. The interval on pass@1 has to come from resampling tasks or an explicit cluster-adjusted formula, since a bootstrap over individual trials produces one that is too narrow and looks more credible for it. And the cluster count belongs next to the score, which is Miller’s own request.
How many tasks, how many trials
The sizing arithmetic follows from the two variance components the last block measured, and it inverts the instinct to buy trials.
Set Var(x) as the between-task variance of the score and E[σ²] as the expected within-task variance. Miller’s variance for the mean is (Var(x) + E[σ²])/n over n questions, and repeated sampling divides the second term by the trial count K. For T tasks the estimate is sqrt((Var(x) + E[σ²]/K) / T), and his rule for how far to push K is stated plainly: “once E[σ²]/K ≪ Var(x), increasing K further will have little effect on the standard error of µ̂”.
Here Var(x) is 0.0739 and E[σ²] is 0.1751, and the block turns those into the tables a planner needs.
1
2
3
4
5
6
7
8
9
10
11
12
13
14
15
16
17
18
19
20
21
22
23
24
25
26
27
28
29
30
31
32
33
34
35
import numpy as np
from math import comb

TASKS = 100
p = np.random.default_rng(11).uniform(0.05, 0.95, TASKS)
var_between = p.var(ddof=1)
var_within = np.mean(p * (1 - p))
Z = 1.959964 + 0.841621          # 95% two-sided, 80% power


def se(t, k):
    return np.sqrt((var_between + var_within / k) / t)


print(f"variance between tasks {var_between:.4f}, within task {var_within:.4f}\n")
print("tasks pinned, 16 trials each")
print(f"{'tasks':>7s}{'SE':>9s}{'95% half-width':>17s}{'MDE, 80% power':>17s}")
for t in (25, 50, 100, 200, 500, 1000, 2000):
    print(f"{t:7d}{se(t,16)*100:8.2f}p{1.96*se(t,16)*100:16.2f}p{Z*se(t,16)*100:16.2f}p")

print("\ntasks required for a stated 95% half-width")
print(f"{'half-width':>12s}{'K=1':>8s}{'K=16':>8s}{'K=64':>8s}")
for h in (0.10, 0.05, 0.02, 0.01):
    print(f"{h*100:11.0f}p" + "".join(f"{(1.96/h)**2 * (var_between + var_within/k):8.0f}"
                                      for k in (1, 16, 64)))

print("\ntrials, with the task count held at 100")
print(f"{'trials/task':>12s}{'SE':>9s}{'share of floor':>17s}")
for k in (1, 4, 16, 64, 256, 1024):
    print(f"{k:12d}{se(100,k)*100:8.2f}p{se(100,k)/se(100,10**9)*100:16.1f}%")

print("\nshare of tasks returning exactly zero for pass^8 at p = 0.5")
for n in (8, 12, 16, 32, 64):
    pct = sum(comb(n, i) for i in range(8)) / 2 ** n * 100
    print(f"{n:6d} trials: {pct:5.1f}%")
1
2
3
4
5
6
7
8
9
10
11
12
13
14
15
16
17
18
19
20
21
22
23
24
25
26
27
28
29
30
31
32
33
34
variance between tasks 0.0739, within task 0.1751

tasks pinned, 16 trials each
  tasks       SE   95% half-width   MDE, 80% power
     25    5.83p           11.42p           16.32p
     50    4.12p            8.07p           11.54p
    100    2.91p            5.71p            8.16p
    200    2.06p            4.04p            5.77p
    500    1.30p            2.55p            3.65p
   1000    0.92p            1.81p            2.58p
   2000    0.65p            1.28p            1.82p

tasks required for a stated 95% half-width
  half-width     K=1    K=16    K=64
         10p      96      33      29
          5p     383     130     118
          2p    2391     815     736
          1p    9565    3260    2945

trials, with the task count held at 100
 trials/task       SE   share of floor
           1    4.99p           183.5%
           4    3.43p           126.2%
          16    2.91p           107.1%
          64    2.77p           101.8%
         256    2.73p           100.5%
        1024    2.72p           100.1%

share of tasks returning exactly zero for pass^8 at p = 0.5
     8 trials:  99.6%
    12 trials:  80.6%
    16 trials:  40.2%
    32 trials:   0.1%
    64 trials:   0.0%
The first table answers “how many tasks”. At 100 tasks and 16 trials the standard error is 2.91 points, the 95% half-width 5.71 points, and the smallest difference detectable at 80% power 8.16 points. A two-point improvement off a 100-task eval is something that eval could not have measured. At 500 tasks the MDE falls to 3.65 points, at 2,000 to 1.82; the scaling is square-root, so each halving costs four times the tasks.
The second table prices a stated interval. A 10-point half-width needs 96 tasks at one trial, 33 at 16, 29 at 64. A 2-point half-width, the resolution most changelog claims imply, needs 2,391 tasks at one trial, 815 at 16 and still 736 at 64. Trials help and the help shrinks fast: one trial to 64 cuts the requirement by 3.3 times, not 64.
The third table is why. With tasks fixed, the standard error falls from 4.99 points at one trial to 2.91 at 16, then 2.77 at 64 and 2.72 at 1,024, which are 101.8%, 100.5% and 100.1% of the infinite-trial floor. Past 16 trials, going to 1,024 costs 64 times the compute and buys 6.5% of an interval. The fixture’s threshold, E[σ²]/(0.05 × Var(x)), is 47 trials.
The fourth table catches anyone who sizes for pass@k and then computes pass^8. A task contributes only if it has at least k successes: at p = 0.5 and 8 trials, 99.6% of tasks contribute exactly zero; at 16 trials 40.2%; at 32 trials 0.1%. The estimator stays unbiased, because the zeros are correct draws. It does not stay precise. At 16 trials four tasks in ten add nothing, so the mean is computed over six and the interval has to say so. Run trials at least four times k before quoting pass^k, and prefer 16 or more.
What to check before you publish a number
| Question | Publish | Fails when |
|---|---|---|
| Is the number any-of-k or all-of-k? | the metric name with its k, both values | a pass@8 is quoted as “reliability” |
| Which estimator produced it? | the combinatorial form, in log space | 1-(1-p)^k from a stored pass@1, low by up to 0.68 points here |
| Does k match the trial budget? | trials per task, and trials ÷ k | k=8 off 3 trials; 40.2% zero contributions at 16 trials |
| What is the unit of resampling? | tasks, with the task count stated | a pooled-trial interval, 8.8× too narrow at 256 trials |
| Could this eval see the effect claimed? | MDE at 80% power for those tasks | a 2-point claim off 100 tasks, MDE 8.16 points |
| Is the retry cost attached? | tokens or dollars per solved task | a pass@k that rises with sampling and reports neither |
The first two rows are cheap to fix. The middle two are budget lines settled before the run, not after.
Key takeaways
| Question | Answer from the measurements |
|---|---|
| Do pass@k and pass^k measure the same thing? | No. pass@8 matched at 0.879 while pass@1 differed by 33 points and pass^8 by 11,483× |
| Is the Codex estimator fragile? | Not in precision (2.3e-14). It runs out of range at n=1100 |
| Which form is quietly biased? | the plug-in 1-(1-p)^k, low by 0.68 points at 20 successes in 200 trials |
| Why is the usual interval too narrow? | it resamples trials. The task is the cluster: 8.8× at 256 trials, 2.2× at 16 |
| How many tasks do I need? | 2-point half-width: 815 at 16 trials, 736 at 64. Tasks scale with the square |
| How many trials do I need? | enough that E[σ²]/K sits far below Var(x): 47 here, and 4×k for pass^k |
The estimator errors cost a fraction of a point and are fixable with three lines of arithmetic. The uncertainty errors cost a factor of nearly nine on the interval and cannot be fixed afterwards, because the task set is what it is.
References
- Chen, M. et al. “Evaluating Large Language Models Trained on Code.” 2021 — arXiv:2107.03374 — equation 1, the Figure 3 script, appendix A.
- Yao, S., Shinn, N., Razavi, P. and Narasimhan, K. “τ-bench: A Benchmark for Tool-Agent-User Interaction in Real-World Domains.” 2024 — arXiv:2406.12045 — the pass^k definition, 115 retail and 50 airline tasks.
- Kapoor, S. et al. “AI Agents That Matter.” 2024 — arXiv:2407.01502 — the accuracy-versus-cost argument and the AlphaCode retry figures.
- Miller, E. “Adding Error Bars to Evals: A Statistical Approach to Language Model Evaluations.” 2024 — arXiv:2411.00640 — the variance decomposition, clustered standard errors, and Table 4.
- Abadie, A. et al. “When should you adjust standard errors for clustering?” Quarterly Journal of Economics 138(1), 2022 — doi:10.1093/qje/qjac038 — when the correction applies.
- Efron, B. “Bootstrap Methods: Another Look at the Jackknife.” Annals of Statistics 7(1), 1979 — doi:10.1214/aos/1176344552 — the resampling procedure used above.
Related posts
- Is Your +3-Point Eval Gain Real? — the two-system axis: McNemar, paired bootstrap, and the item count a comparison needs.
- What a Contamination Check Buys You — whether the score you are sizing came from data the model had already seen.
- Inter-Annotator Agreement Before You Train — the same clustering question applied to labels rather than scores.
- Your WHERE Clause Ate the Recall — sizing a candidate pool, where the square-root arithmetic applies to a query budget instead.